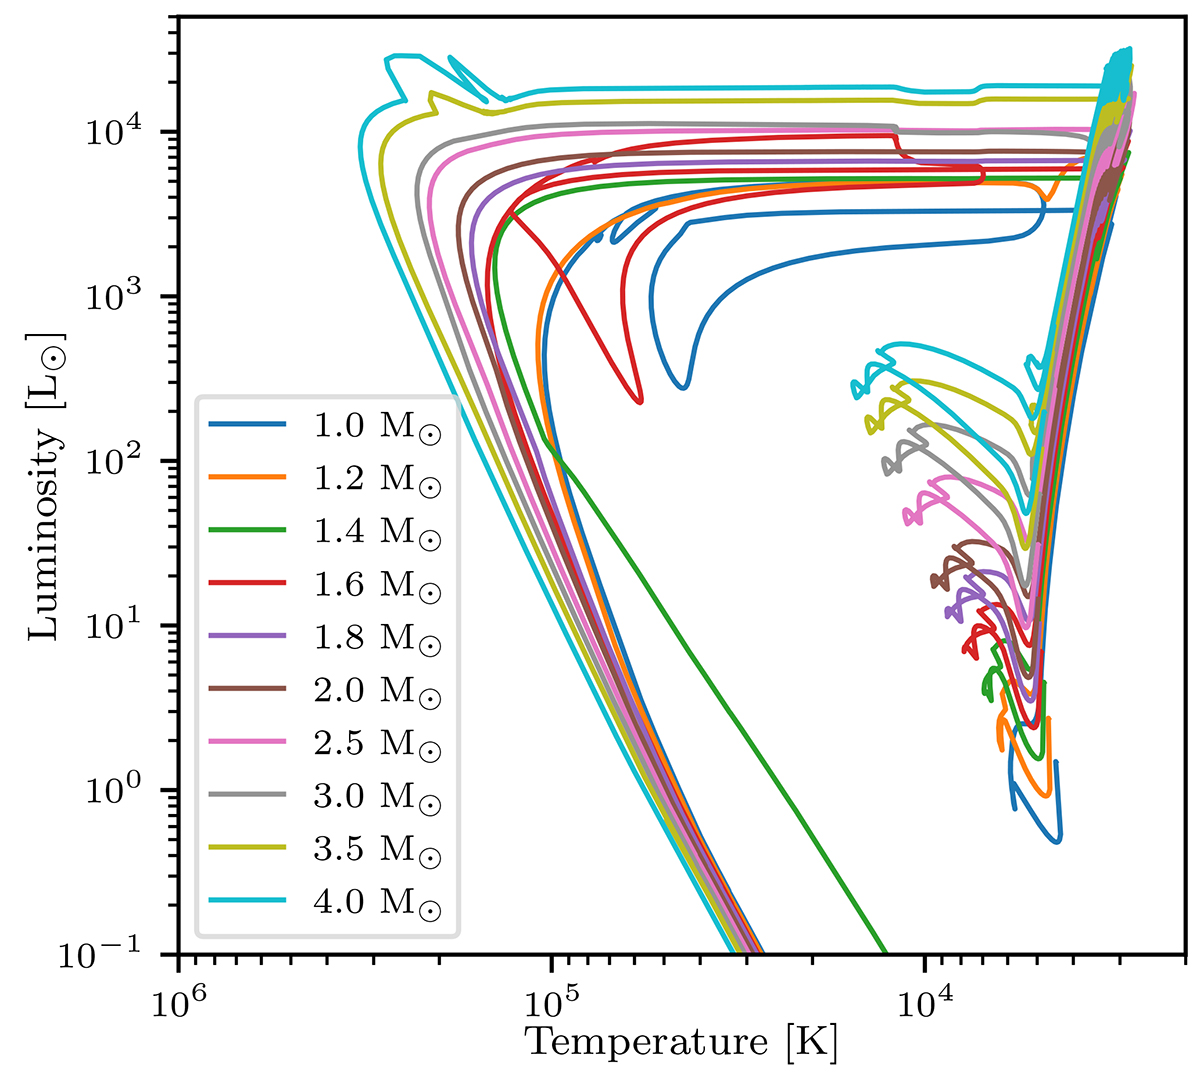
Fig. 3.
Download original image
Hertzsprung-Russell diagram of the stellar evolutionary models studied here. The models start in the PMS and are evolved up to the WD phase. Different colours indicate a different ZAMS mass, as indicated in the box in the left-bottom corner.
Current usage metrics show cumulative count of Article Views (full-text article views including HTML views, PDF and ePub downloads, according to the available data) and Abstracts Views on Vision4Press platform.
Data correspond to usage on the plateform after 2015. The current usage metrics is available 48-96 hours after online publication and is updated daily on week days.
Initial download of the metrics may take a while.