Fig. 3

Download original image
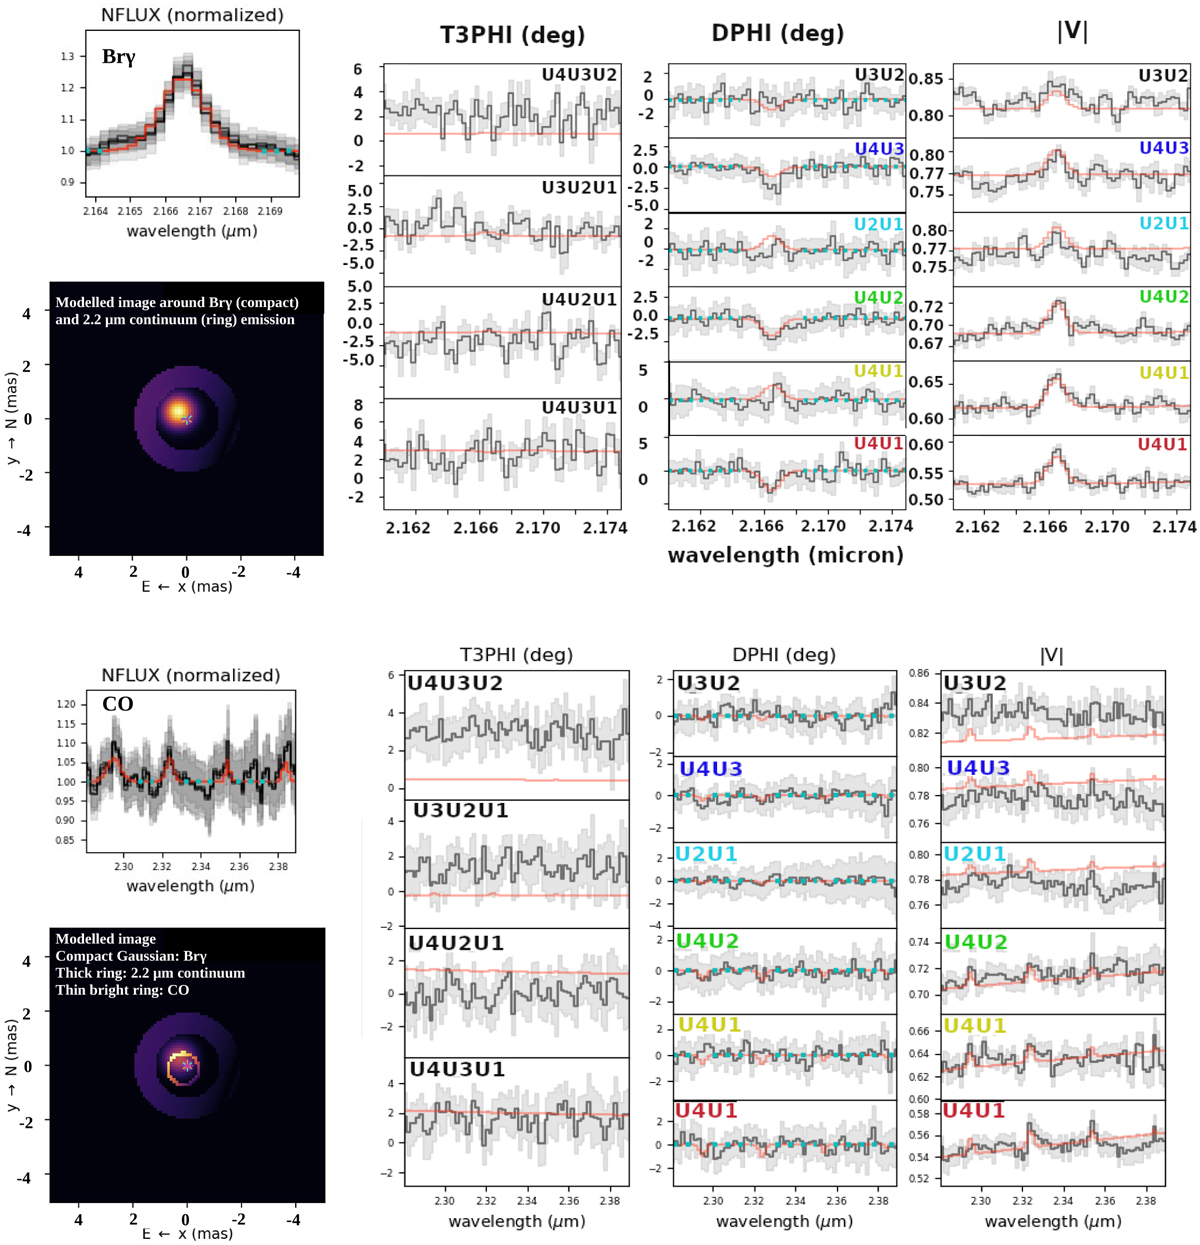
Model image of G033.3891 of the 2.2 µm continuum emission (thick ring) combined with the Brγ (compact Gaussian) and CO bandhead molecular emission (thin bright ring). The modelled image of the CO emission is the average of the individual images of the CO bandheads extracted at their central wavelengths (2.29, 2.32, 2.35, and 2.38 µm). The total geometric model (red line) fits well all interferometric observables (closure phases, T3PHI; differential phases, DPHI; visibilities, V; normalised flux, NFLUX) of the continuum, Brγ, and CO bandheads. PMOIRED normalises the flux from both the data and the model using the same algorithm. The grey shades represent the systematic errors of the interferometric observables, taking into account the calibration and transfer function uncertainties. The colour scheme of the different baselines follows Figure 1.
Current usage metrics show cumulative count of Article Views (full-text article views including HTML views, PDF and ePub downloads, according to the available data) and Abstracts Views on Vision4Press platform.
Data correspond to usage on the plateform after 2015. The current usage metrics is available 48-96 hours after online publication and is updated daily on week days.
Initial download of the metrics may take a while.


