Fig. A.1
Download original image
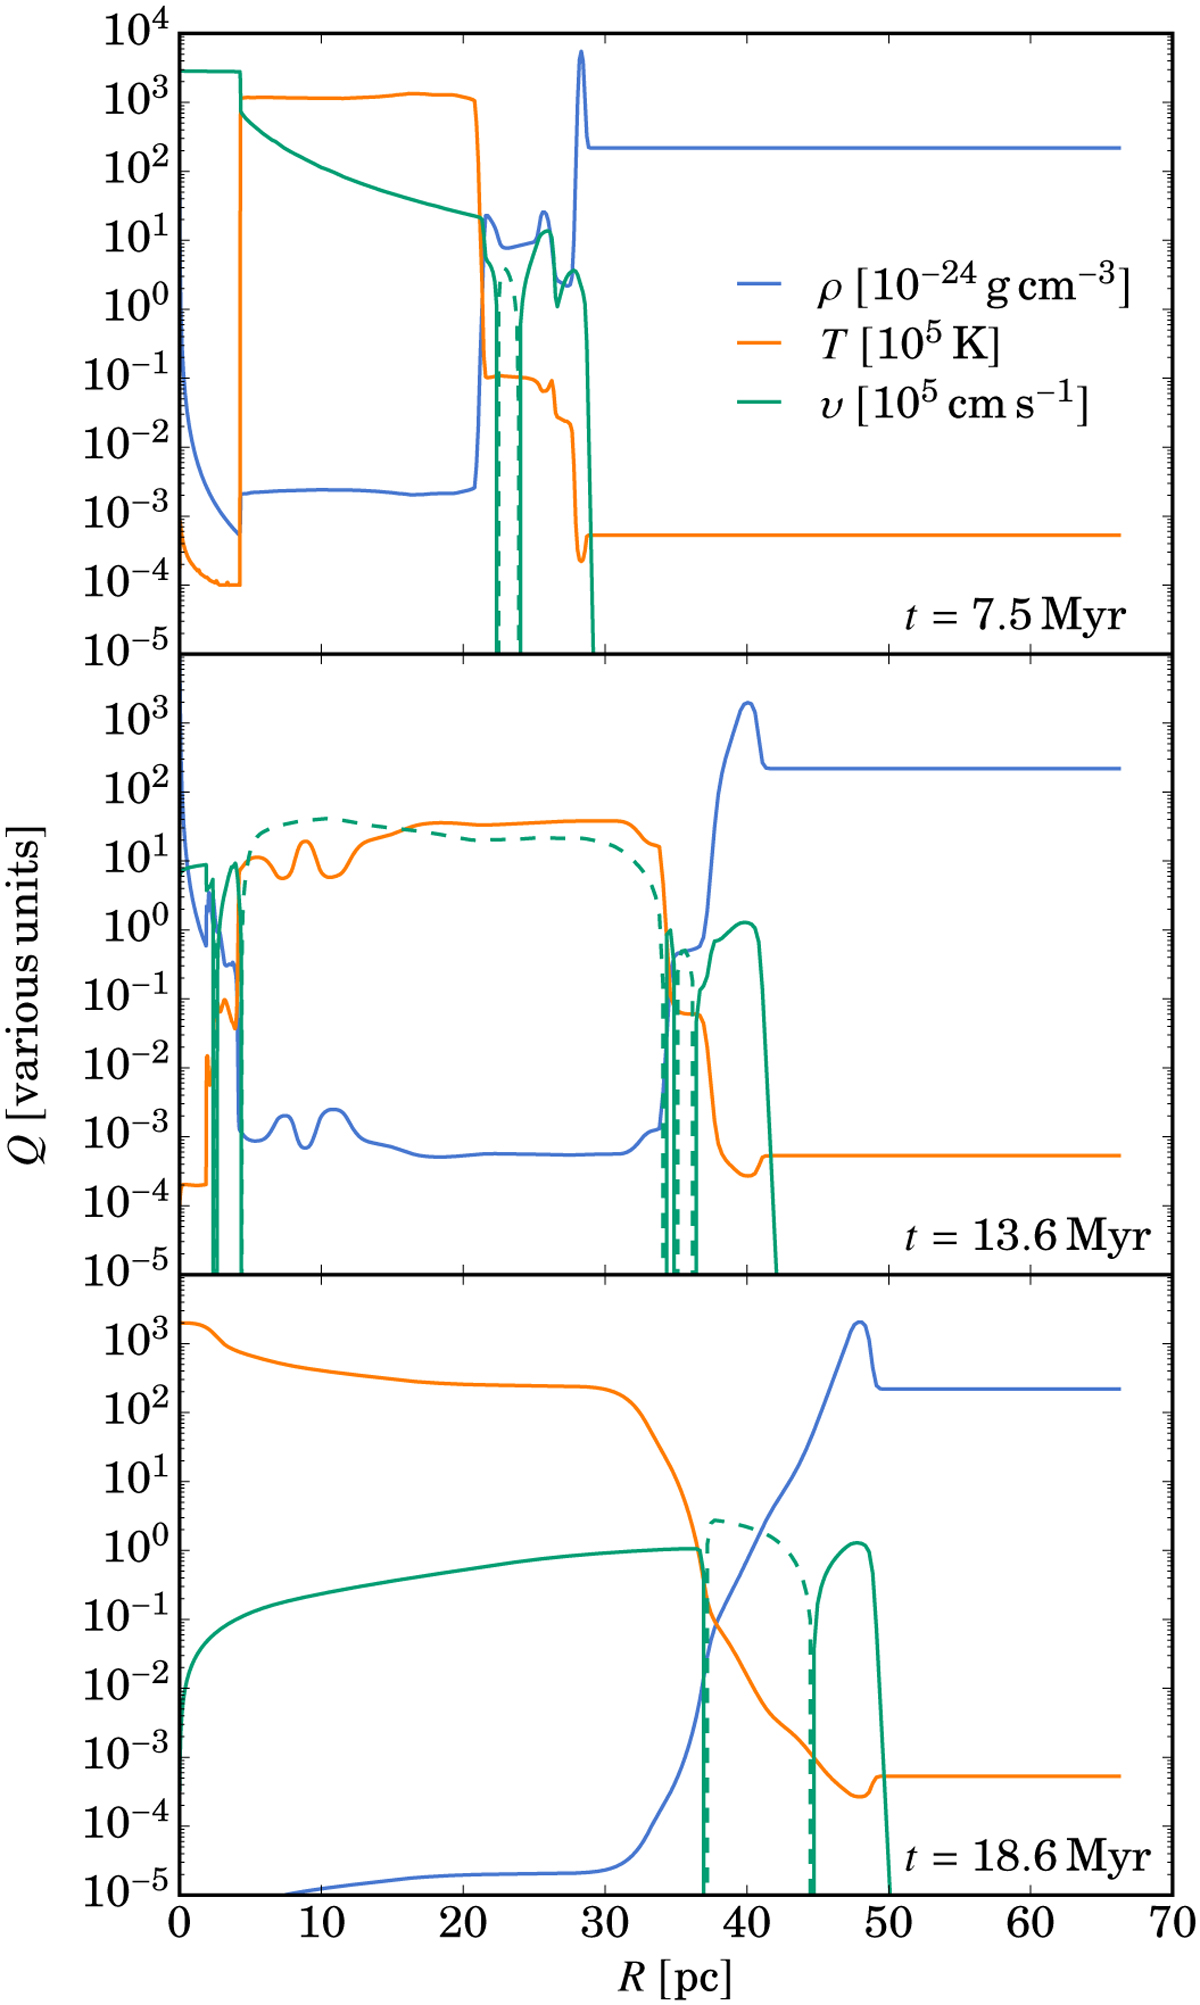
Density, temperature and velocity profile of a PION simulation with a binary system of Z = 0.004, log10(P [days]) = 1.0 and log10(Mp [M⊙]) = 1.4, in a uniform medium of n = 100 cm−3 at the end of the primary lifetime (top), at the end of the secondary lifetime (middle) and 5 Myr after the secondary SN (bottom). Dashed lines indicate negative velocities.
Current usage metrics show cumulative count of Article Views (full-text article views including HTML views, PDF and ePub downloads, according to the available data) and Abstracts Views on Vision4Press platform.
Data correspond to usage on the plateform after 2015. The current usage metrics is available 48-96 hours after online publication and is updated daily on week days.
Initial download of the metrics may take a while.