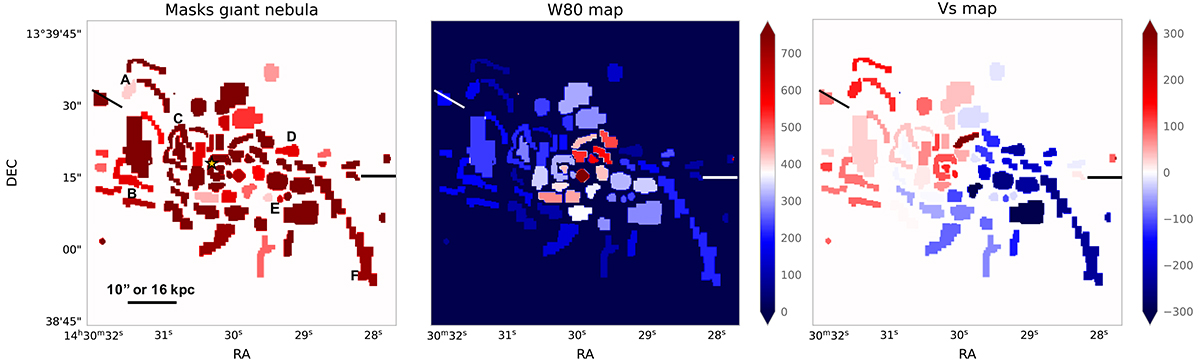
Fig. 2.
Download original image
Map of the masks used in our analysis (left) and [OIII] kinematic maps (middle and right panels). The colours in the first map have no particular meaning but help to differentiate the apertures. A 1D spectrum was extracted from each one, so that a single W80 and Vs (middle and left panels) value is associated with each aperture. Vs is the velocity shift relative to the narrow core of the nuclear [OIII] line. The maps cover the total MUSE FoV (∼1′×1′). W80 and Vs are in km s−1. Letters ‘A’–‘F’, the yellow star, and the solid lines have the same meanings as in Fig. 1.
Current usage metrics show cumulative count of Article Views (full-text article views including HTML views, PDF and ePub downloads, according to the available data) and Abstracts Views on Vision4Press platform.
Data correspond to usage on the plateform after 2015. The current usage metrics is available 48-96 hours after online publication and is updated daily on week days.
Initial download of the metrics may take a while.