Fig. 1.
Download original image
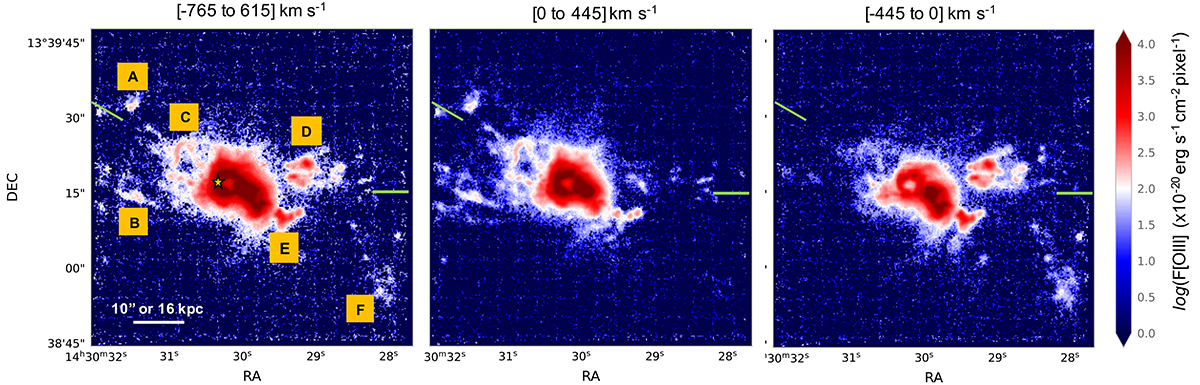
[OIII] continuum subtracted images covering different spectral windows that were selected to highlight the diversity of nebular morphological features. Each image covers a different velocity (i.e. spectral) range relative to the nuclear systemic velocity, as is indicated on top. The nebular morphology strongly varies with velocity. The left panel shows the total [OIII] flux narrow-band image. The well-known ∼10 kpc ionised bubble is marked with a tiny yellow star in the left panel. The green lines indicate the position angles of the radio axis to the northeast and to the west (Harrison et al. 2015). To guide the reader, the letters ‘A’–‘F’ mark some emission line features that can also be identified in the mask map of Fig. 2.
Current usage metrics show cumulative count of Article Views (full-text article views including HTML views, PDF and ePub downloads, according to the available data) and Abstracts Views on Vision4Press platform.
Data correspond to usage on the plateform after 2015. The current usage metrics is available 48-96 hours after online publication and is updated daily on week days.
Initial download of the metrics may take a while.