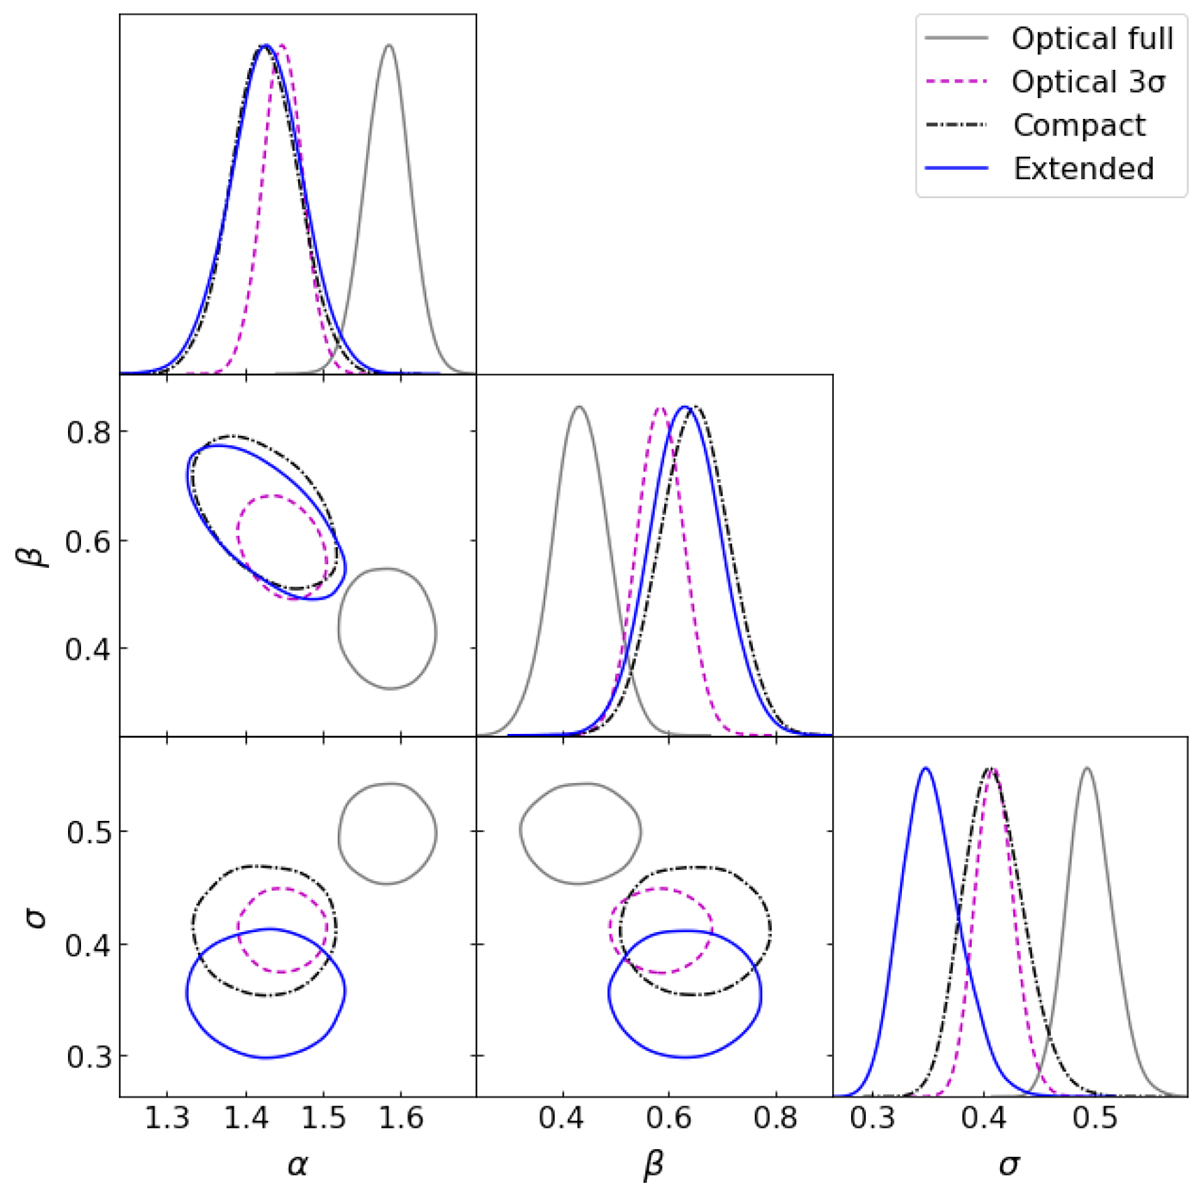
Fig. 3.
Download original image
Large-scale structure density vs. optical luminosity regression parameters for the 0.015 < z < 0.06 groups. Here, α stands for intercept, β – for slope and σ – for the intrinsic scatter. The 2D contours show the 90% significance levels. An optical sample without a 3σ cut is marked with solid grey and with the cut with dashed magenta lines. The compact X-ray sample is marked with dash-dotted black and extended with solid blue. The X-ray clusters exhibit a steeper relation and lower scatter.
Current usage metrics show cumulative count of Article Views (full-text article views including HTML views, PDF and ePub downloads, according to the available data) and Abstracts Views on Vision4Press platform.
Data correspond to usage on the plateform after 2015. The current usage metrics is available 48-96 hours after online publication and is updated daily on week days.
Initial download of the metrics may take a while.