Open Access
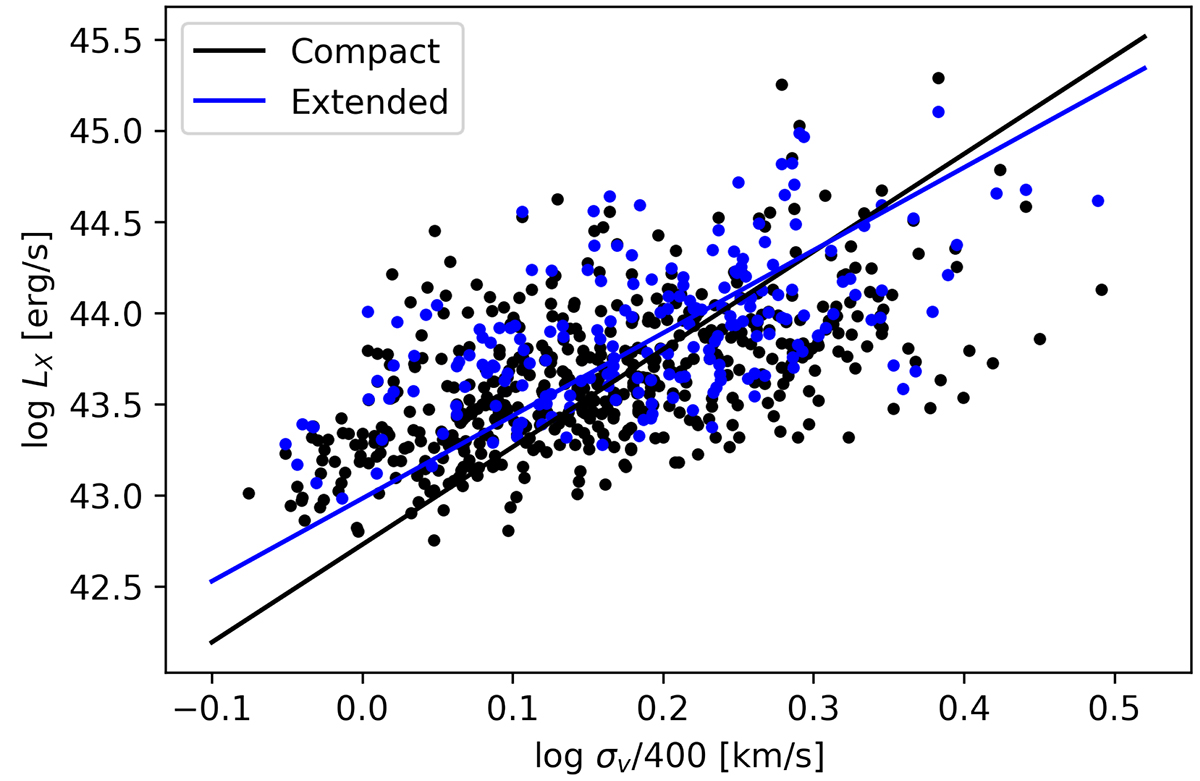
Fig. A.3.
Download original image
X-ray luminosity vs. velocity dispersion. Compact and extended X-ray source samples are plotted with black and blue respectively. Similar to Fig. 6, but for z > 0.06.
Current usage metrics show cumulative count of Article Views (full-text article views including HTML views, PDF and ePub downloads, according to the available data) and Abstracts Views on Vision4Press platform.
Data correspond to usage on the plateform after 2015. The current usage metrics is available 48-96 hours after online publication and is updated daily on week days.
Initial download of the metrics may take a while.