Open Access
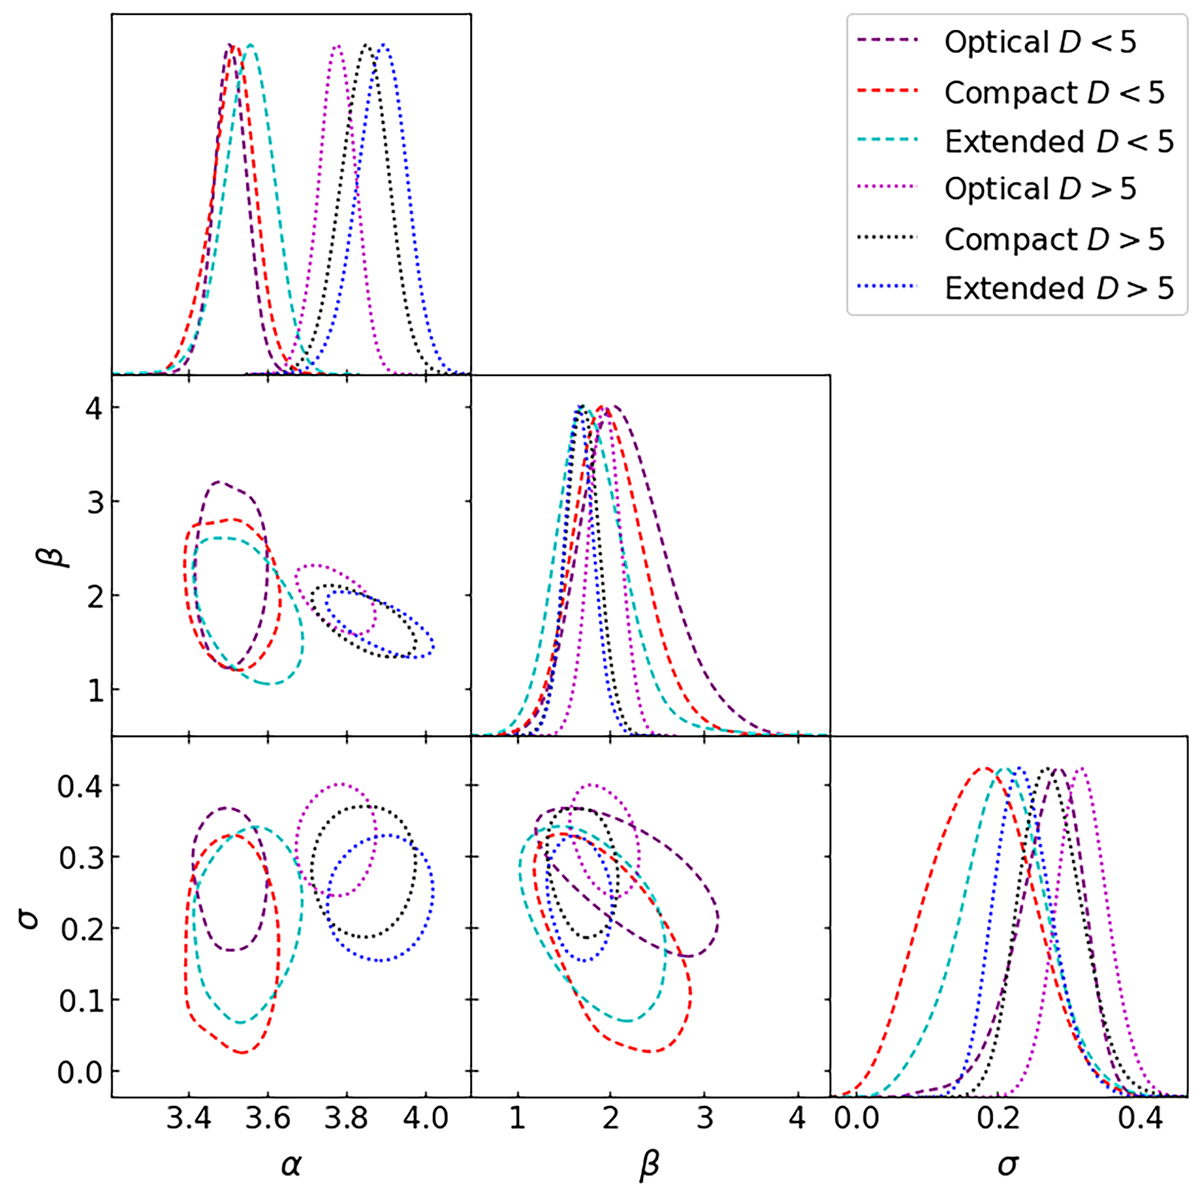
Fig. 17.
Download original image
Optical luminosity vs. velocity dispersion with large scale structure density cut at D10 = 5. Optical sample is marked with a magenta line: dashed for the lower and dotted for the higher large-scale structure density samples. Other details are the same as in Fig. 15.
Current usage metrics show cumulative count of Article Views (full-text article views including HTML views, PDF and ePub downloads, according to the available data) and Abstracts Views on Vision4Press platform.
Data correspond to usage on the plateform after 2015. The current usage metrics is available 48-96 hours after online publication and is updated daily on week days.
Initial download of the metrics may take a while.