Fig. 15.
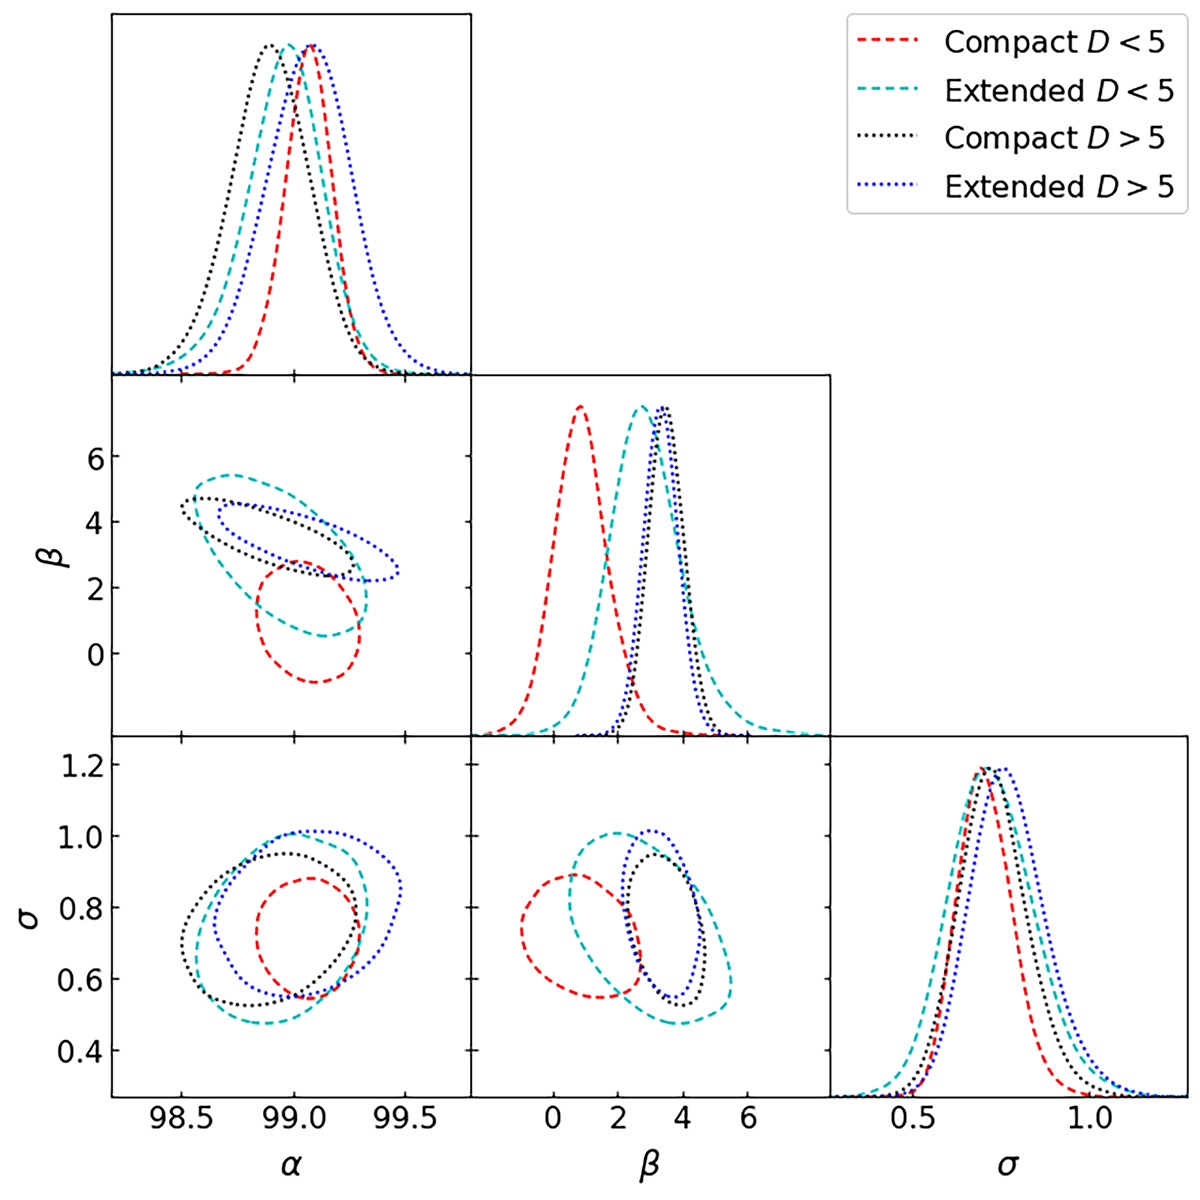
Download original image
X-ray luminosity vs. velocity dispersion with large scale structure density cut at D10 = 5. Black circles show the compact and blue circles show the extended X-ray source samples, with D10 > 5. with their scaling relations as dotted lines. Red and cyan circles show respectively the compact and extended samples having D10 ≤ 5. with scaling relations as dashed lines. Other details are the same as in Fig. 3.
Current usage metrics show cumulative count of Article Views (full-text article views including HTML views, PDF and ePub downloads, according to the available data) and Abstracts Views on Vision4Press platform.
Data correspond to usage on the plateform after 2015. The current usage metrics is available 48-96 hours after online publication and is updated daily on week days.
Initial download of the metrics may take a while.