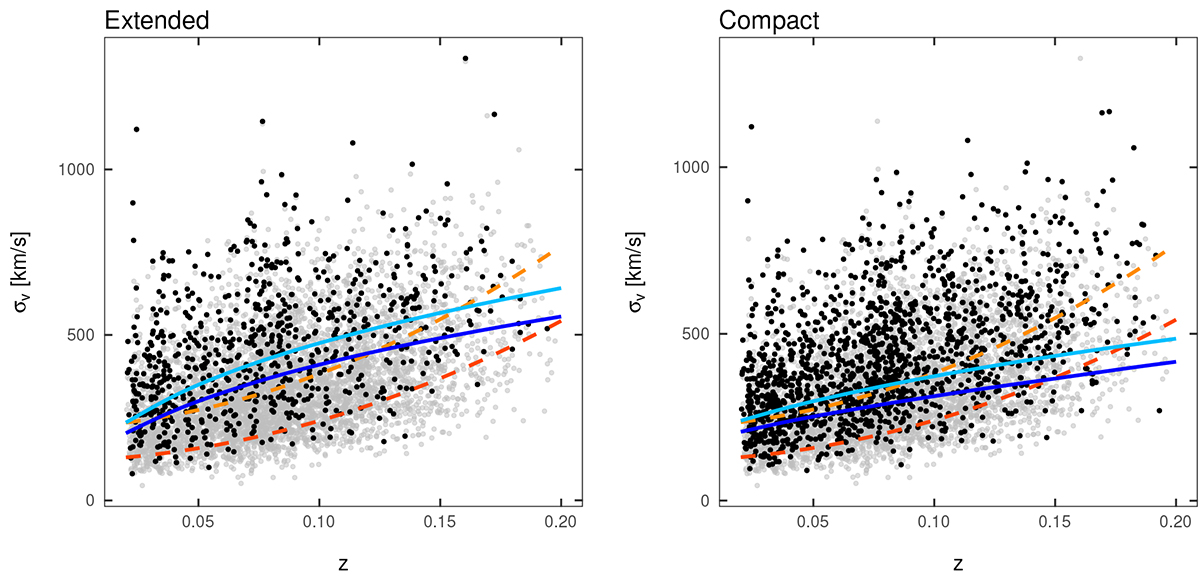
Fig. 1.
Download original image
Sample of extended (left panel) and compact (right panel) X-ray groups (black points). All optical groups are shown with grey points in both panels. Completeness limits for the FoF groups are shown in red (10%) and orange (50% completeness) dashed lines, and for the X-ray groups in dark blue (10%) and light blue (50%) solid lines. Systems below the 10% X-ray completeness limit are removed from the catalogues. We applied the same extended source cleaning to all catalogues used in the analysis.
Current usage metrics show cumulative count of Article Views (full-text article views including HTML views, PDF and ePub downloads, according to the available data) and Abstracts Views on Vision4Press platform.
Data correspond to usage on the plateform after 2015. The current usage metrics is available 48-96 hours after online publication and is updated daily on week days.
Initial download of the metrics may take a while.