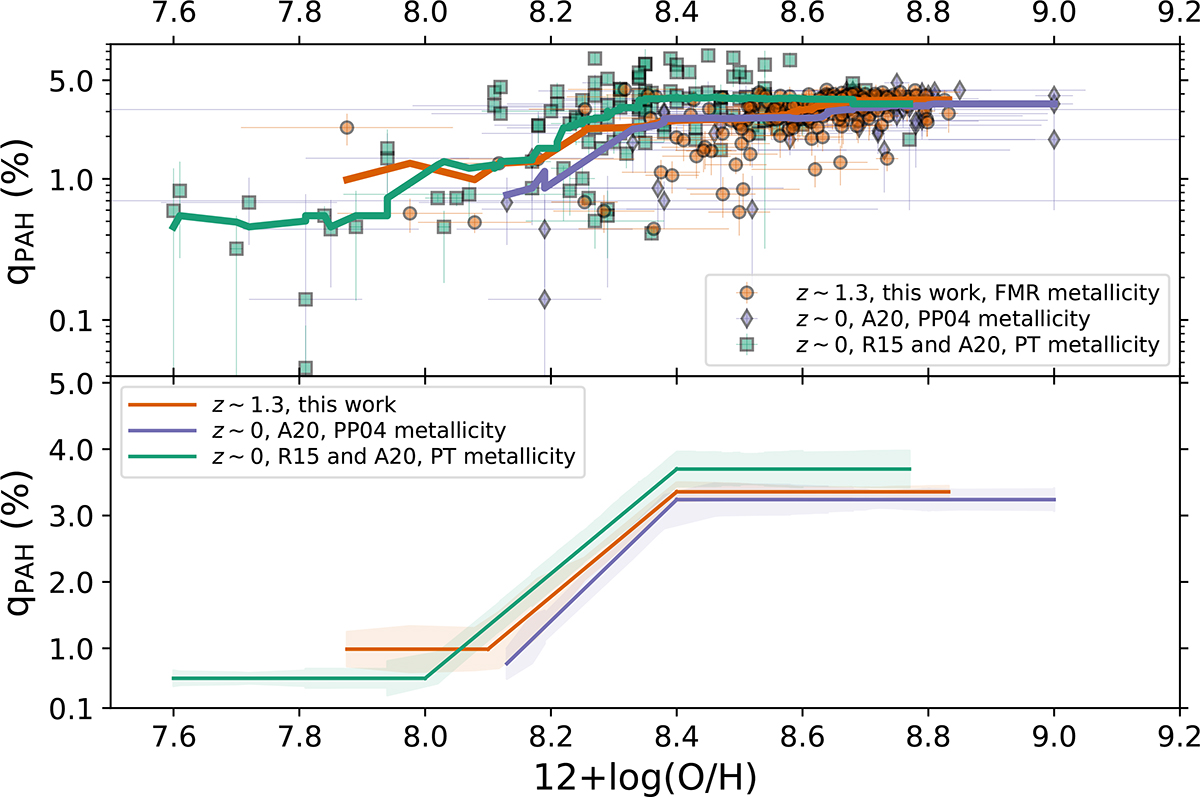
Fig. 9.
Download original image
PAH mass fraction as a function of metallicity at z ∼ 1.3 (this work) and z ∼ 0 (Aniano et al. 2020; Rémy-Ruyer et al. 2015). Here, we only include the robust qPAH sample at z ∼ 0.7 − 2.0. Top: The z ∼ 1.3 data presented in this work is shown with orange circles. The orange line shows the moving median. Metallicity of the z ∼ 1.3 sample is estimated using the FMR relation of Sanders et al. (2021). The z ∼ 0 data is shown for the PP04 metallicity calibrations of Aniano et al. (2020) (purple diamonds, and purple line for the moving median) and the PT metallicity calibrations of Aniano et al. (2020) and Rémy-Ruyer et al. (2015) (green squares, and the green line for the moving median). The Rémy-Ruyer et al. (2015) data extend the z ∼ 0 sample to much lower metallicities. The two metallicity calibrations are systematically different (on average ∼0.2 dex but can be up to 0.4 dex); therefore, we show both for completeness. Bottom: Three-step fits (constant+linear+constant) to the moving median trends in the top panel. The shaded regions show the error in the mean in each consecutive bin of the moving median. Despite the uncertainties in metallicities, the overall qPAH-metallicity behaviour of the z ∼ 0 and z ∼ 1.3 samples are similar within the scatter.
Current usage metrics show cumulative count of Article Views (full-text article views including HTML views, PDF and ePub downloads, according to the available data) and Abstracts Views on Vision4Press platform.
Data correspond to usage on the plateform after 2015. The current usage metrics is available 48-96 hours after online publication and is updated daily on week days.
Initial download of the metrics may take a while.