Fig. 8.
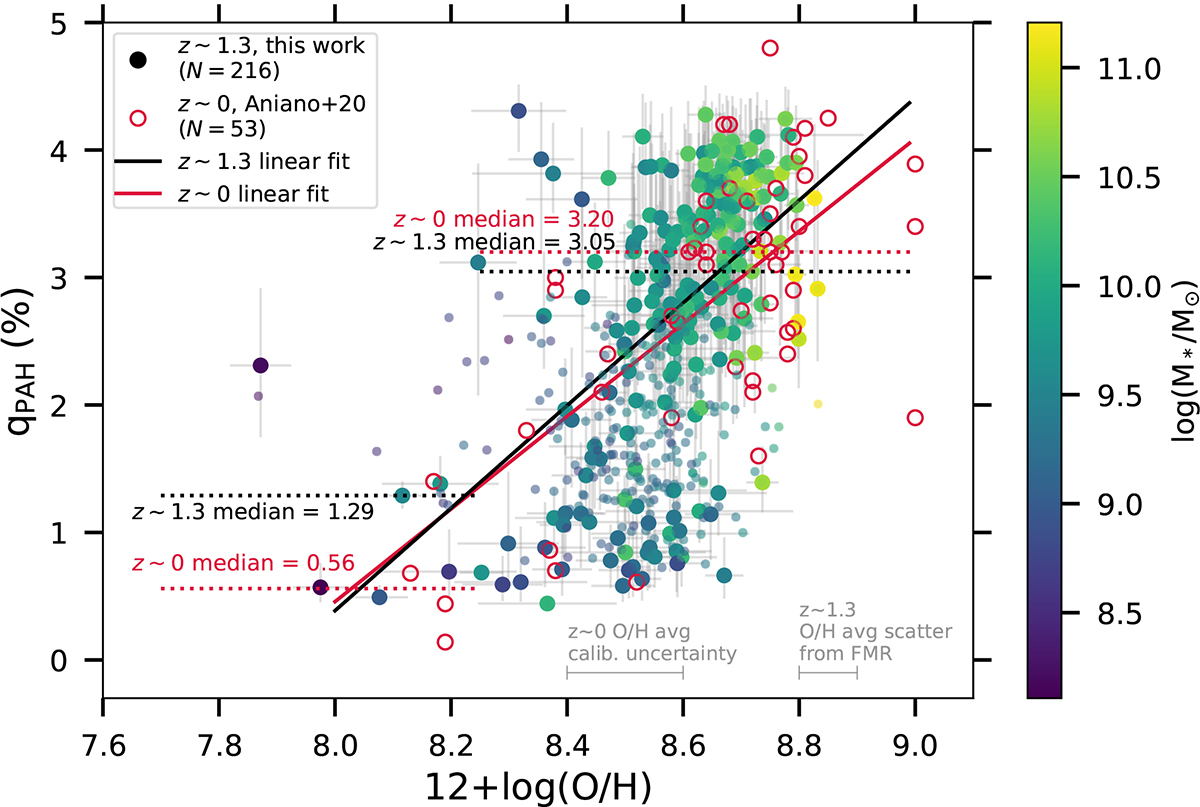
Download original image
PAH mass fraction versus metallicity. Metallicity was derived from the FMR of Sanders et al. (2021). The robust and low-confidence qPAH samples (Section 2.2) are shown with larger and smaller circles, respectively. We provide the values of the robust sample in Table 1. The z ∼ 0 data from Aniano et al. (2020) are shown in red. Following the analysis of Aniano et al. (2020), we fit both samples with a linear function, shown with solid lines (slopes of 3.63 ± 0.71 and 4.04 ± 0.51 and intercepts of −28.60 ± 6.14 and −31.94 ± 4.38 for the z ∼ 0 and 1.3 sample, respectively). The medians of the two samples below and above 12 + log(O/H) = 8.25 (dotted lines) are also shown. The two samples follow very similar trends. The average scatter in 12 + log(O/H) from FMR (0.05 dex, see text) and the strong-line metallicity calibration uncertainty for the z ∼ 0 sample (0.2 dex; Aniano et al. 2020) are shown in the bottom right. The error bars on the z ∼ 1.3 data are the metallicity measurement uncertainties from the SFR and mass uncertainties. The linear fits (solid lines) have slopes of 3.6 and 3.4 for the z ∼ 0 and 1.3 samples, respectively.
Current usage metrics show cumulative count of Article Views (full-text article views including HTML views, PDF and ePub downloads, according to the available data) and Abstracts Views on Vision4Press platform.
Data correspond to usage on the plateform after 2015. The current usage metrics is available 48-96 hours after online publication and is updated daily on week days.
Initial download of the metrics may take a while.