Fig. 7.
Download original image
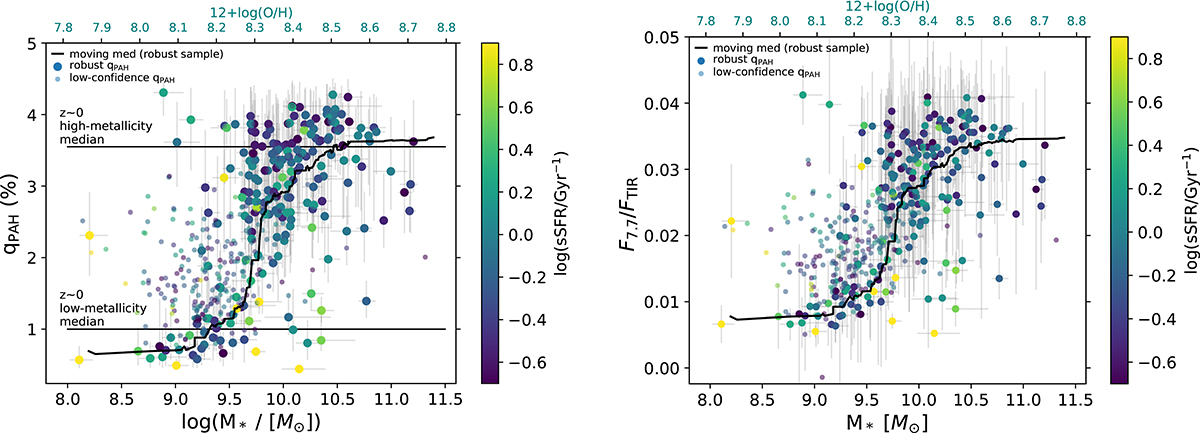
PAH mass fraction (left) and luminosity fraction (right) as a function of stellar mass. Moving median (black curve) is shown for the robust qPAH sample (see Section 2.2 for the definition of samples), and all galaxies are colour-coded by sSFR. In the left panel, horizontal lines show the median PAH mass fractions of z ∼ 0 galaxies with 12 + log(O/H) < 8.1 and > 8.1 from Draine et al. (2007). On the top x-axes, we also show the estimated metallicities from the O3N2-based mass-metallicity relation (MZR) of Topping et al. (2021) at z ∼ 1.5, and assuming the Pettini & Pagel (2004) calibration. The z ∼ 0.7 − 2 sample has a very similar qPAH-metallicity behaviour to that inferred at z ∼ 0. Properties of the robust sample are in Table 1.
Current usage metrics show cumulative count of Article Views (full-text article views including HTML views, PDF and ePub downloads, according to the available data) and Abstracts Views on Vision4Press platform.
Data correspond to usage on the plateform after 2015. The current usage metrics is available 48-96 hours after online publication and is updated daily on week days.
Initial download of the metrics may take a while.