Fig. 5.
Download original image
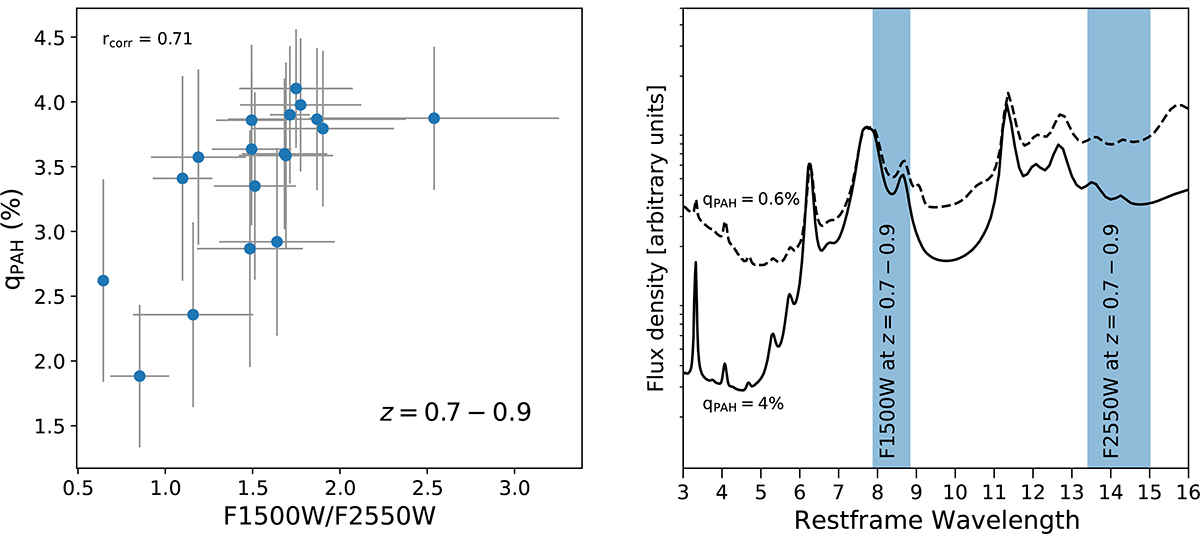
Left panel: PAH-to-dust mass fraction (qPAH) versus 15 μm (F1500W) to 25.5 μm (F2550W) flux ratios for a sample of z = 0.7 − 0.9 galaxies with significant (> 3σ) detections in F1500W and F2550W. qPAH is derived from PROSPECTOR (the Draine & Li 2007 models), while the flux ratio is an empirical tracer of PAH to warm dust emission, as is shown in the right panel. The significant linear correlation of the two quantities (Pearson correlation coefficient of 0.71 with p-value = 0.001) indicates the validity of the estimated qPAH values. Right panel: Two mid-IR spectra with a high PAH fraction (solid) and low PAH fraction (dashed), overlaid with the wavelength coverage of the F1500W and F2550W filters at z = 0.7 − 0.9. In this redshift range, F1500W and F2550W filters trace the PAH dominated and non-PAH-dominated dust emission in star-forming galaxies, respectively. Therefore, their ratio is expected to correlate with PAH fraction.
Current usage metrics show cumulative count of Article Views (full-text article views including HTML views, PDF and ePub downloads, according to the available data) and Abstracts Views on Vision4Press platform.
Data correspond to usage on the plateform after 2015. The current usage metrics is available 48-96 hours after online publication and is updated daily on week days.
Initial download of the metrics may take a while.