Fig. 4.
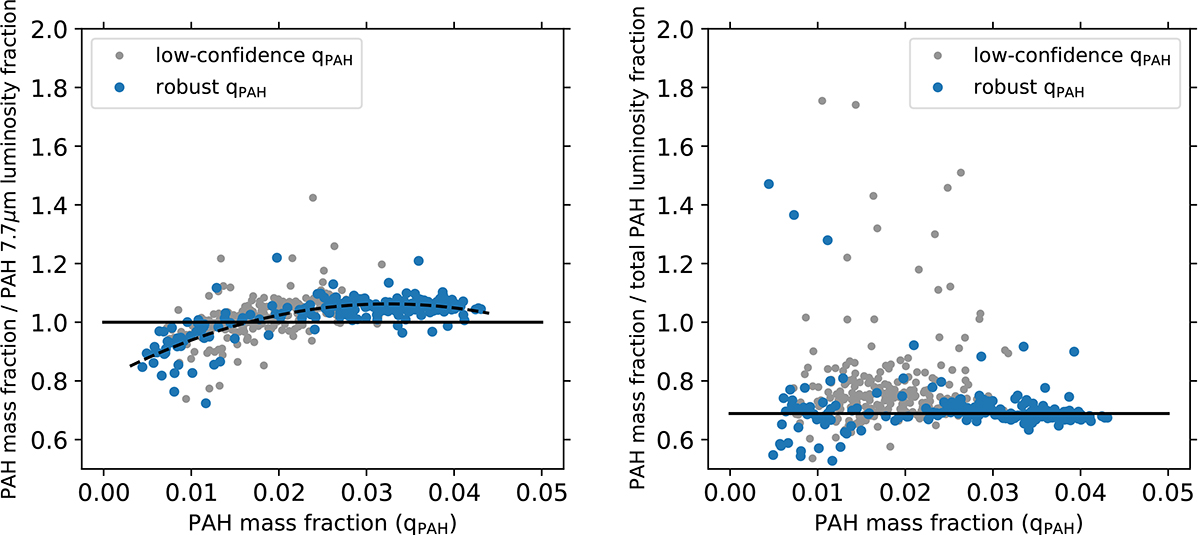
Download original image
Ratio of the PAH-to-dust mass fraction to the PAH-to-total IR luminosity fraction versus the PAH mass fraction in our sample. Both quantities are derived from the Draine & Li (2007) models (Section 2.3). Robust qPAH sample shows galaxies with qPAH with > 3σ significance or less than 0.5% error (Section 2.2). Left: PAH luminosity fraction is defined as the ratio of the PAH 7.7 μm feature luminosity to total IR luminosity. Horizontal line is the unity line. The robust sample is fit with a polynomial function shown with a dashed curve (Equation (1)). Right: PAH luminosity is the sum of the 3.3, 6.2, 7.7, 11.2, and 17 μm PAH features luminosities (Section 2.3.1). Horizontal line shows the median of the robust sample (0.68). We note that qPAH is not in percentage units, unlike the other figures in this paper.
Current usage metrics show cumulative count of Article Views (full-text article views including HTML views, PDF and ePub downloads, according to the available data) and Abstracts Views on Vision4Press platform.
Data correspond to usage on the plateform after 2015. The current usage metrics is available 48-96 hours after online publication and is updated daily on week days.
Initial download of the metrics may take a while.