Fig. 2.
Download original image
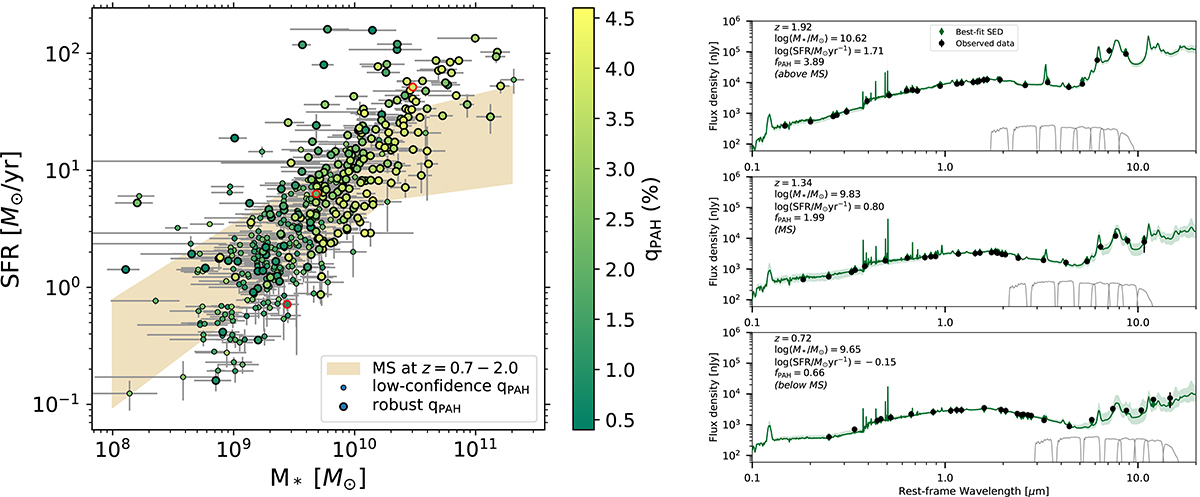
Left panel: SFR versus stellar mass of the sample. The sample is divided into those with robust and low-confidence PAH mass fractions (same as in Figure 3). The shaded region indicates star-forming main sequence at the redshift range of our galaxies, z = 0.7 − 2.0, derived from the PROSPECTOR-inferred SFR and mass of Leja et al. (2022), same as the SFR and stellar masses inferred in this work. Three SED examples of the symbols with red edges are shown on the right. Right panel: Examples of the SEDs of three galaxies that are above, on, and below the main sequence, shown with the red edges in the left plot. The MIRI filter transmission curves are also shown. The wealth of data from HST, NIRCam, and MIRI provides robust SED fits for this sample at z = 0.7 to 2.0. More examples of the SED fits are provided in the online repository: https://zenodo.org/records/12671075.
Current usage metrics show cumulative count of Article Views (full-text article views including HTML views, PDF and ePub downloads, according to the available data) and Abstracts Views on Vision4Press platform.
Data correspond to usage on the plateform after 2015. The current usage metrics is available 48-96 hours after online publication and is updated daily on week days.
Initial download of the metrics may take a while.