Fig. 12.
Download original image
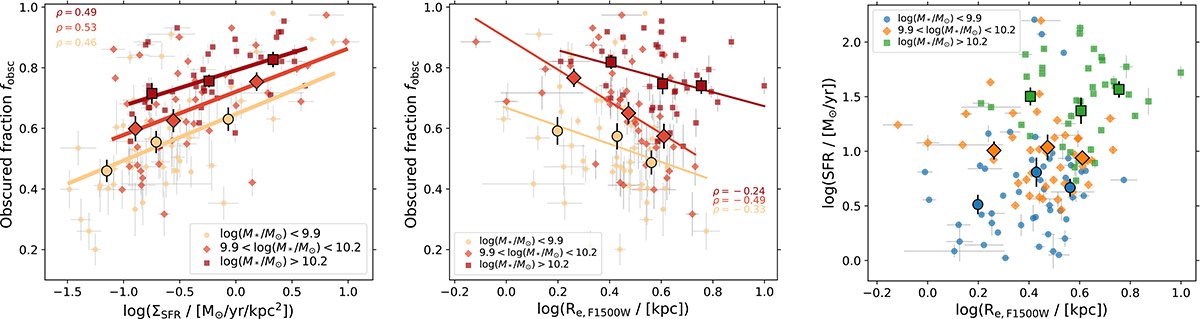
Obscured luminosity fraction as a function of ΣSFR (using F1500W sizes) and F1500W effective radius (middle) for the F1500W spatially resolved sample (the filter FWHM is 0.5 arcsec). At a given mass, fobsc increases with ΣSFR and decreases with rest-frame mid-IR (dust) radii. Right panel shows SFR versus F1500W size for the same sample. The near constant SFR with Re, F1500W in each mass bin indicates that the relationship between fobsc and size is independent of SFR. Individual measurements are shown with small symbols and colour-coded in three stellar mass bins with the same number of galaxies, shown in the legend. In each mass bin, average values in bins of the parameter on the x axis are shown with larger symbols with the corresponding shape and colour of the mass bin. Pearson correlation coefficients (ρ) are shown in the corners of the plots with corresponding colours of each mass bin. Linear fits to the average values of fobsc versus log(ΣSFR) are shown in the left panel. The fit parameters are in Table 3.
Current usage metrics show cumulative count of Article Views (full-text article views including HTML views, PDF and ePub downloads, according to the available data) and Abstracts Views on Vision4Press platform.
Data correspond to usage on the plateform after 2015. The current usage metrics is available 48-96 hours after online publication and is updated daily on week days.
Initial download of the metrics may take a while.