Fig. 11.
Download original image
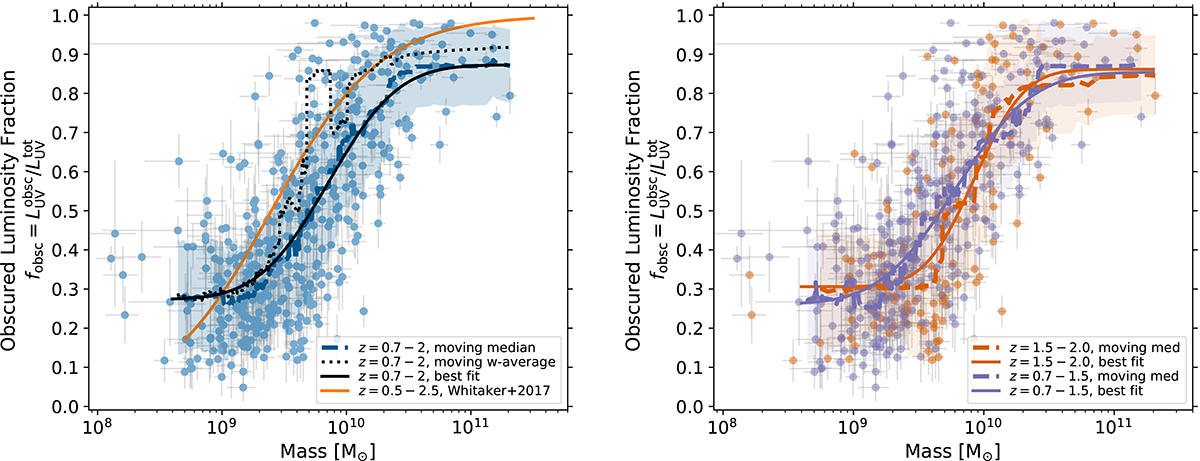
Obscured luminosity fraction as a function of stellar mass for the full sample (left) and separated by redshift (right). Obscured fraction is defined as the obscured UV to total (intrinsic) UV luminosity at 1550 Å, inferred from the best-fit UV-to-IR SEDs. We show the moving median (dashed thick lines), moving weighted-average (dotted line) and best-fit curve (solid lines) to the samples at M* > 4 × 10⁸ M⊙, where the data is mass-complete. In the left panel, we also show the Whitaker et al. (2017) fit to z = 0.5 − 2.5 with an orange curve. The Whitaker et al. (2017) study was based on Spitzer/MIPS data with a wider area but biased to more obscured systems. Our weighted-average trend is also dominated by the heavily obscured systems, and therefore similar to the (Whitaker et al. 2017) curve. However, the median trend that is more representative of the full population captured by the deeper MIRI data (relative to the MIPS data) is systematically lower. Furthermore, as is shown in the right panel, there is no redshift evolution in this relation in our sample.
Current usage metrics show cumulative count of Article Views (full-text article views including HTML views, PDF and ePub downloads, according to the available data) and Abstracts Views on Vision4Press platform.
Data correspond to usage on the plateform after 2015. The current usage metrics is available 48-96 hours after online publication and is updated daily on week days.
Initial download of the metrics may take a while.