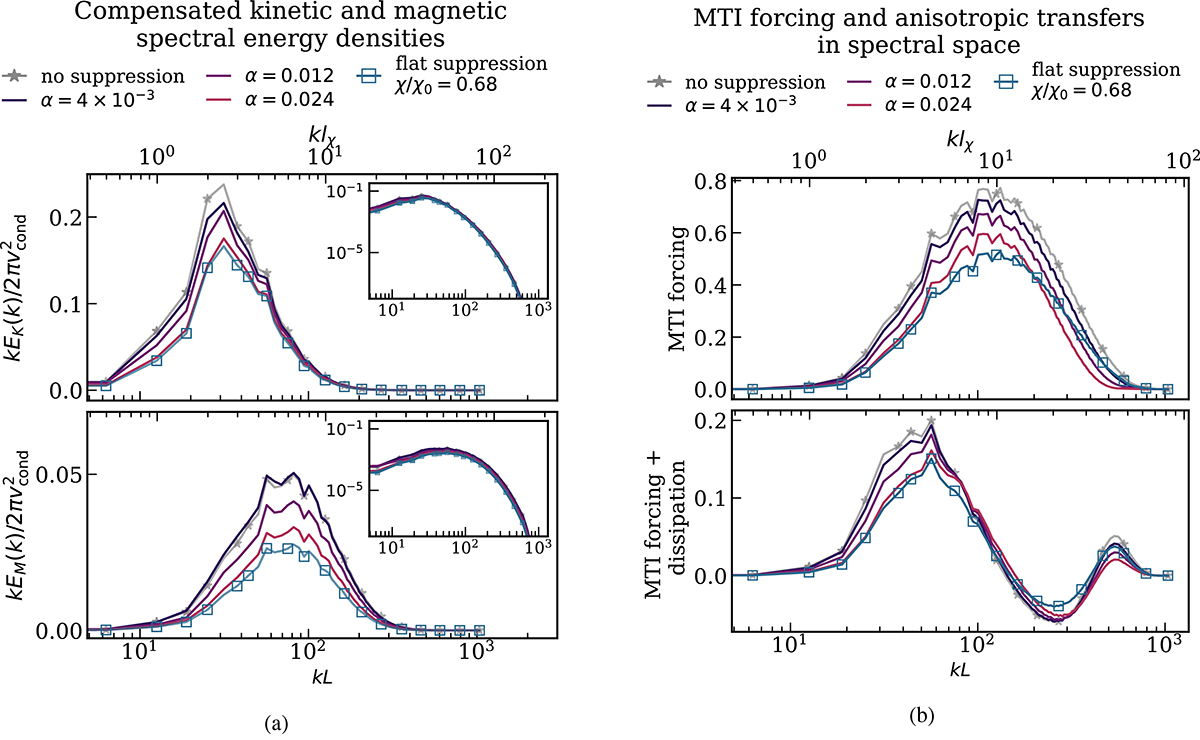
Fig. 9.
Download original image
Spectral energy densities and spectral energy fluxes in our 3D runs at saturation, averaged over hundreds of dynamical times. Left: Compensated spectral energy densities (i.e., multiplied by the wave number k) of the kinetic (top) and magnetic fluctuations (bottom). The y-axis is in linear scale to highlight the differences between the runs. For comparison, we show in the insets the kinetic and magnetic (uncompensated) power spectra in log-log scale. Right: compensated MTI energy injection (top) and balance between MTI injection and anisotropic thermal dissipation (bottom) in spectral space in 3D simulations. Despite the reduction in MTI energy injection due to increasingly strong whistler suppression, the final balance between injection and dissipation remains mostly unchanged over a wide range of scales below the conduction length lχ.
Current usage metrics show cumulative count of Article Views (full-text article views including HTML views, PDF and ePub downloads, according to the available data) and Abstracts Views on Vision4Press platform.
Data correspond to usage on the plateform after 2015. The current usage metrics is available 48-96 hours after online publication and is updated daily on week days.
Initial download of the metrics may take a while.