Fig. 7.
Download original image
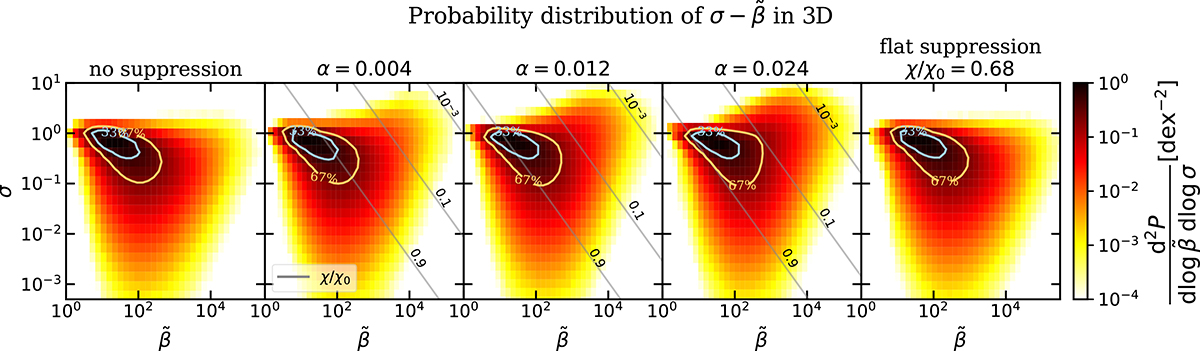
Distribution of the data in the ![]() –σ plane for our 3D runs at saturation. The color bar represents the probability density of finding a value in the infinitesimal interval of size
–σ plane for our 3D runs at saturation. The color bar represents the probability density of finding a value in the infinitesimal interval of size ![]() . The cyan and gold curves are isocontours of the probability distribution function that enclose 33% and 67% of the box volume, respectively. The solid gray contour lines in the plots with whistler suppression show the amount of suppression of the thermal diffusivity (to the left of any given line are regions with diffusivity larger than the number quoted, in units of χ0). Due to the intermittent nature of magnetic fields, with whistler-suppression most of the plasma is located in regions with strong magnetic fields (low χ suppression), while at the same time we note the formation of high-β lobes consisting of regions that are not isothermal along field lines. This feature is not captured in the reference simulations with flat or no suppression.
. The cyan and gold curves are isocontours of the probability distribution function that enclose 33% and 67% of the box volume, respectively. The solid gray contour lines in the plots with whistler suppression show the amount of suppression of the thermal diffusivity (to the left of any given line are regions with diffusivity larger than the number quoted, in units of χ0). Due to the intermittent nature of magnetic fields, with whistler-suppression most of the plasma is located in regions with strong magnetic fields (low χ suppression), while at the same time we note the formation of high-β lobes consisting of regions that are not isothermal along field lines. This feature is not captured in the reference simulations with flat or no suppression.
Current usage metrics show cumulative count of Article Views (full-text article views including HTML views, PDF and ePub downloads, according to the available data) and Abstracts Views on Vision4Press platform.
Data correspond to usage on the plateform after 2015. The current usage metrics is available 48-96 hours after online publication and is updated daily on week days.
Initial download of the metrics may take a while.