Fig. 5.
Download original image
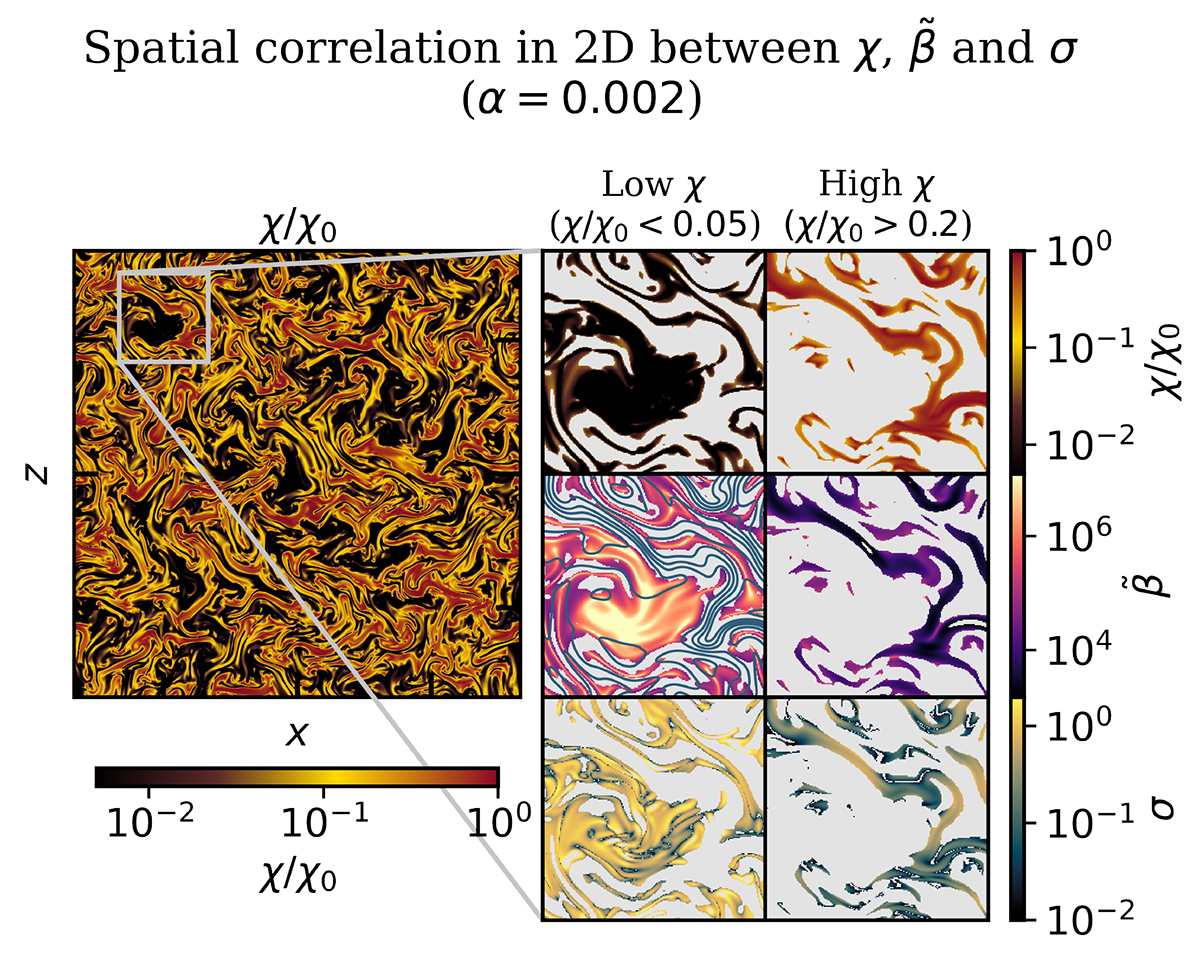
Zoomed-in view of the snapshot of the 2D run with α = 2 × 10⁻³ at time t = 150 ωT−1 showing the spatial correlation between ![]() and σ. In the inset we separately show regions with low (left column) and high (right column) thermal diffusivity by cutting out regions where χ/χ0 is above 0.05 and below 0.2, respectively. In the second row of the inset, left column, the magnetic field lines are shown in blue. With whistler suppression, regions of high thermal conductivity are shaped as thin bundles near filaments of strong magnetic fields and act in a similar way as Autobahns for the heat-carrying electrons.
and σ. In the inset we separately show regions with low (left column) and high (right column) thermal diffusivity by cutting out regions where χ/χ0 is above 0.05 and below 0.2, respectively. In the second row of the inset, left column, the magnetic field lines are shown in blue. With whistler suppression, regions of high thermal conductivity are shaped as thin bundles near filaments of strong magnetic fields and act in a similar way as Autobahns for the heat-carrying electrons.
Current usage metrics show cumulative count of Article Views (full-text article views including HTML views, PDF and ePub downloads, according to the available data) and Abstracts Views on Vision4Press platform.
Data correspond to usage on the plateform after 2015. The current usage metrics is available 48-96 hours after online publication and is updated daily on week days.
Initial download of the metrics may take a while.