Fig. 4.
Download original image
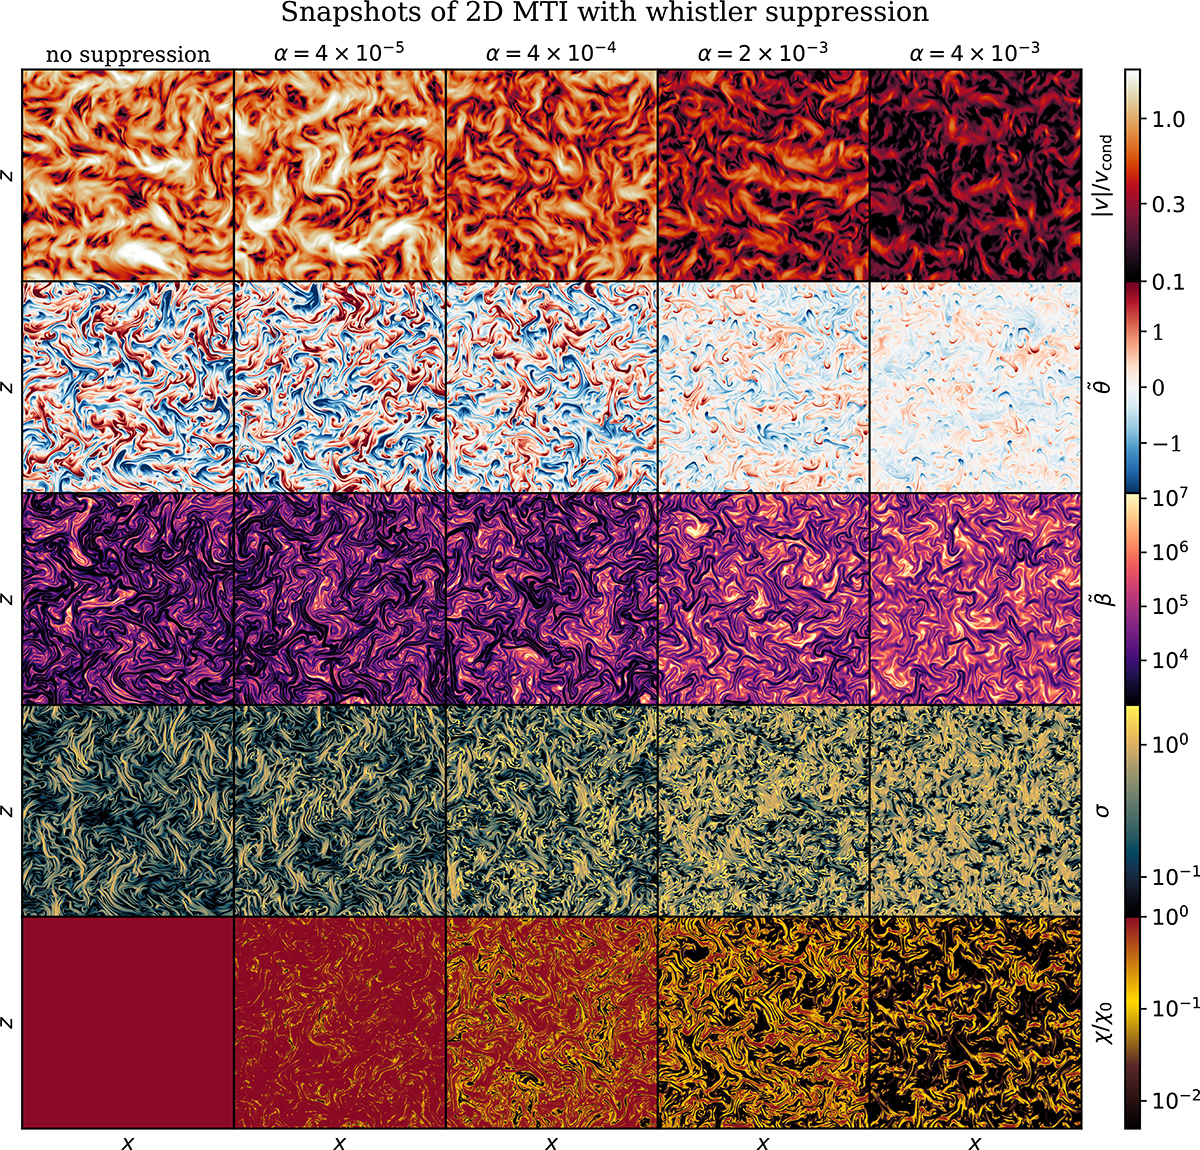
Multiplot of the 2D runs at saturation ordered by increasing suppression of thermal diffusivity (from left to right). From top to bottom: Magnitude of the velocity field, density fluctuation, Boussinesq plasma beta, Boussinesq parallel temperature length, point-wise thermal diffusion suppression fraction. The color bar is in common for each row. A higher suppression parameter α leads to weaker MTI turbulence, weaker magnetic fields (higher ![]() ), less isothermal fieldlines (higher σ), and lower average thermal conductivity χ.
), less isothermal fieldlines (higher σ), and lower average thermal conductivity χ.
Current usage metrics show cumulative count of Article Views (full-text article views including HTML views, PDF and ePub downloads, according to the available data) and Abstracts Views on Vision4Press platform.
Data correspond to usage on the plateform after 2015. The current usage metrics is available 48-96 hours after online publication and is updated daily on week days.
Initial download of the metrics may take a while.