Fig. 3.
Download original image
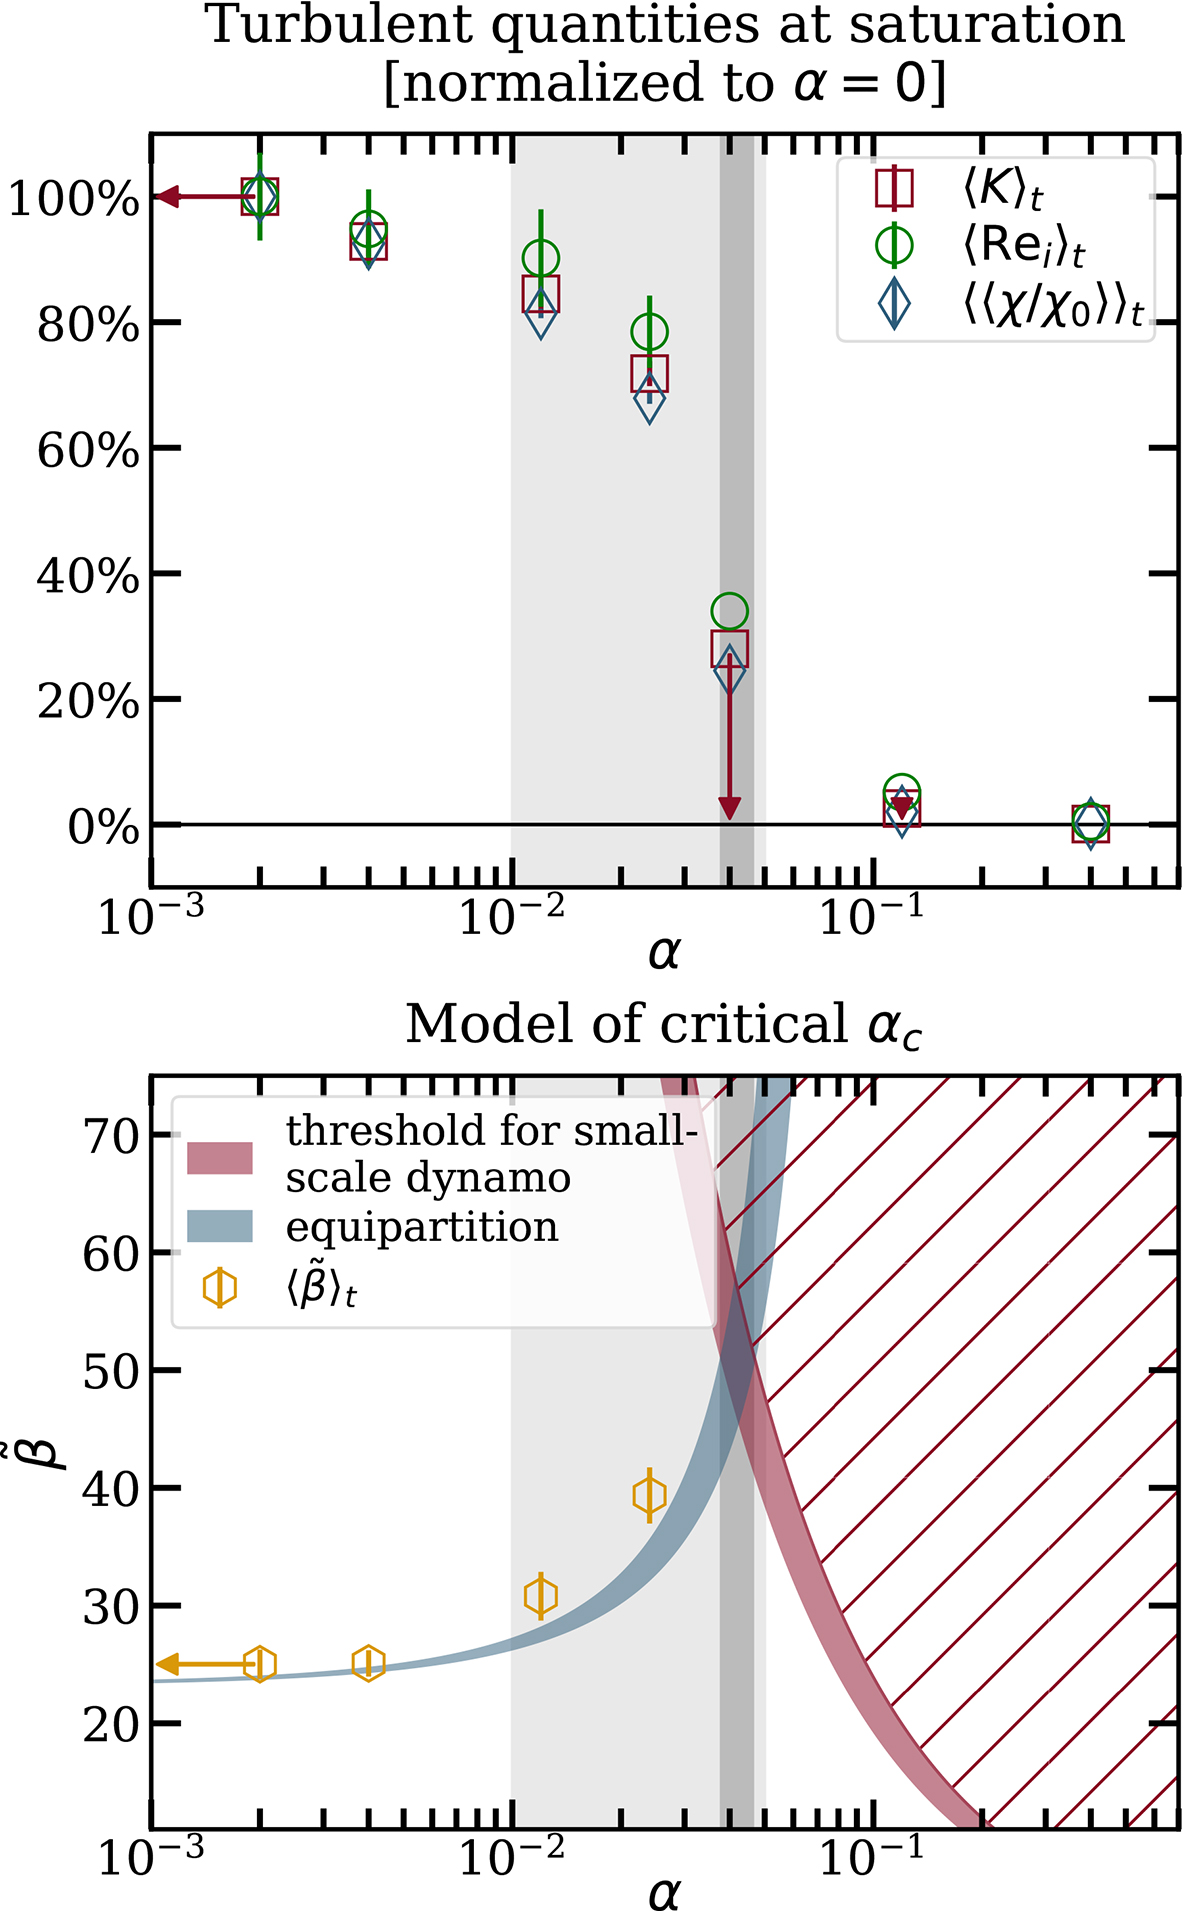
Critical transition to the dead state with whistler suppression. Top panel: Time-averaged turbulent kinetic energies, Reynolds number at the integral scale, and average suppression factor for our 3D runs as a function of α. The values are normalized to those of the unsuppressed run. The leftmost point, corresponding to α = 0, was placed at α = 2 × 10⁻³ for visualization purposes. The three rightmost data points represent decaying runs, thus we do not show error bars. The light gray shaded region indicates the approximate range of the α parameter for typical ICM parameters (see Table 1), while the dark gray shaded region represents the predicted critical α where the transition from MTI turbulence to dead state occurs. Bottom panel: Model for critical α with whistler suppression (see text). The blue band indicates the equipartition value of ![]() with the MTI turbulence (Eq. 33). The red band divides the
with the MTI turbulence (Eq. 33). The red band divides the ![]() space into two regions: where an SSD is possible (below the curve) and where the SSD is not sustainable (hatched region) (see Eq. (36)). The two bands cross approximately at α ≃ 0.038 − 0.046 above which MTI turbulence dies. The gold symbols show the saturated values of
space into two regions: where an SSD is possible (below the curve) and where the SSD is not sustainable (hatched region) (see Eq. (36)). The two bands cross approximately at α ≃ 0.038 − 0.046 above which MTI turbulence dies. The gold symbols show the saturated values of ![]() for the nondecaying runs.
for the nondecaying runs.
Current usage metrics show cumulative count of Article Views (full-text article views including HTML views, PDF and ePub downloads, according to the available data) and Abstracts Views on Vision4Press platform.
Data correspond to usage on the plateform after 2015. The current usage metrics is available 48-96 hours after online publication and is updated daily on week days.
Initial download of the metrics may take a while.