Fig. 2.
Download original image
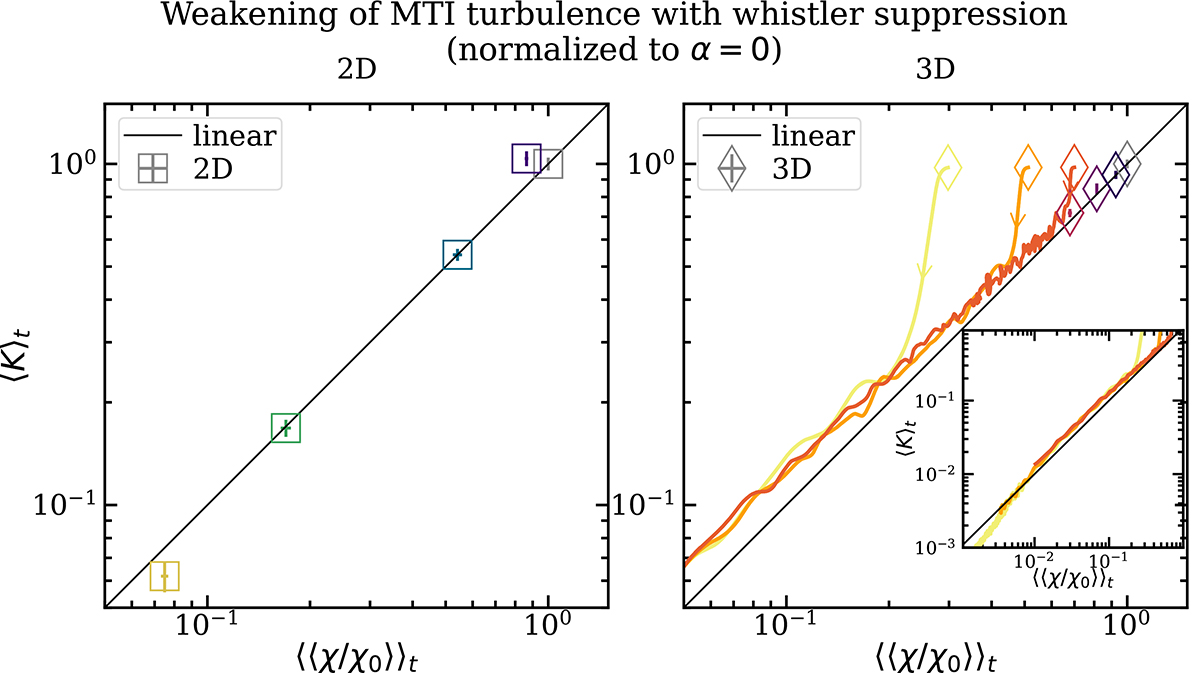
Time-averaged kinetic energy vs. mean suppression factor for our 2D simulations (left panel) and 3D simulations (right panel). The points are color-coded as in Fig. 1. In 2D the time-averages were performed over a window of t = [130, 170] ωT−1 to reduce contamination by the large-scale g modes. In 3D we show time-averages for the three surviving runs only, while the three decaying runs are shown as solid lines (the full extent of the decay is shown in the inset). In both panels the black solid line represents a relation of linear proportionality. The linear proportionality between conductivity and turbulence levels found in PL22a and PL22b is seen to remain valid in an average sense in simulations including whistler-suppression of thermal conduction.
Current usage metrics show cumulative count of Article Views (full-text article views including HTML views, PDF and ePub downloads, according to the available data) and Abstracts Views on Vision4Press platform.
Data correspond to usage on the plateform after 2015. The current usage metrics is available 48-96 hours after online publication and is updated daily on week days.
Initial download of the metrics may take a while.