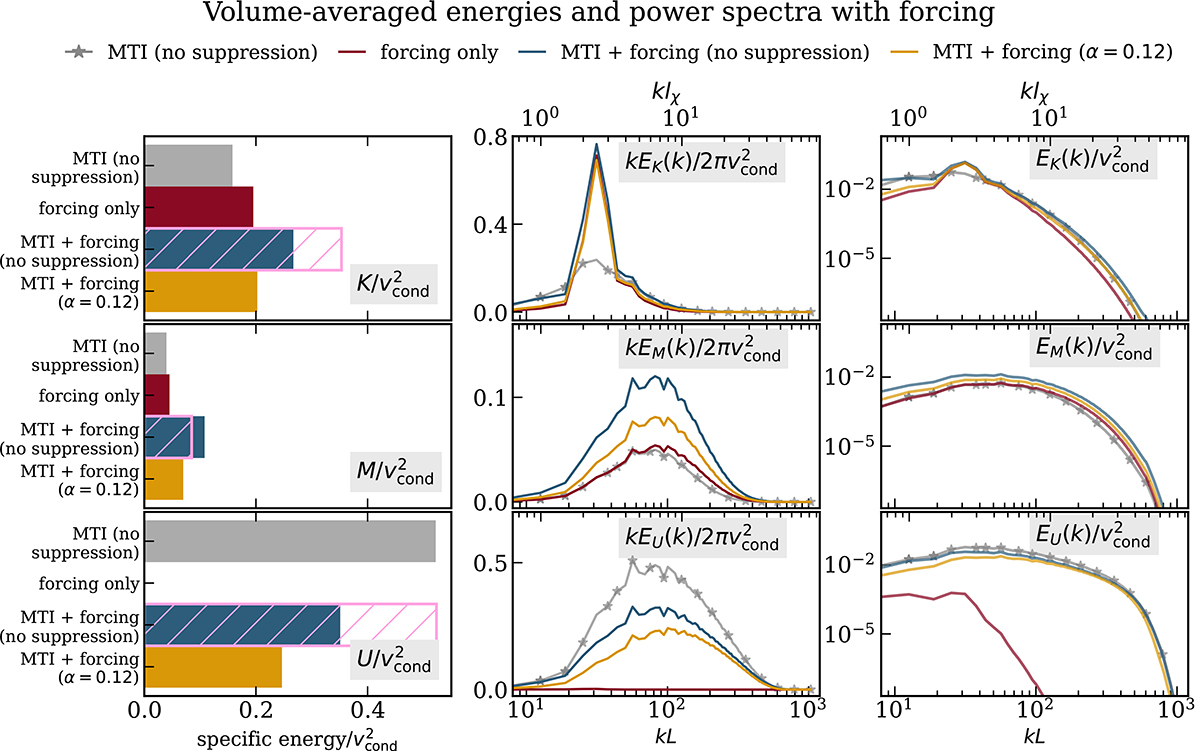
Fig. 11.
Download original image
Volume-averaged and spectral energy densities for the 3D runs with and without external forcing at saturation. From left to right: Bar plot of the volume-averaged turbulent energies, compensated (i.e., multiplied by k), and uncompensated spectral energy densities. The color legend is in common between the bar plots and the power spectra. The pink hashed bars in the left column mark the sum of the energy levels of the MTI-only and forcing-only runs. The peak in the kinetic energy near lχ indicates the wave numbers excited by the external forcing. The turbulent driving of the MTI and the external forcing do not add up exactly for the kinetic energy, but nearly so for the magnetic energy. Moreover, the MTI excites velocity fluctuations over a wide range of scales below lχ.
Current usage metrics show cumulative count of Article Views (full-text article views including HTML views, PDF and ePub downloads, according to the available data) and Abstracts Views on Vision4Press platform.
Data correspond to usage on the plateform after 2015. The current usage metrics is available 48-96 hours after online publication and is updated daily on week days.
Initial download of the metrics may take a while.