Fig. 1.
Download original image
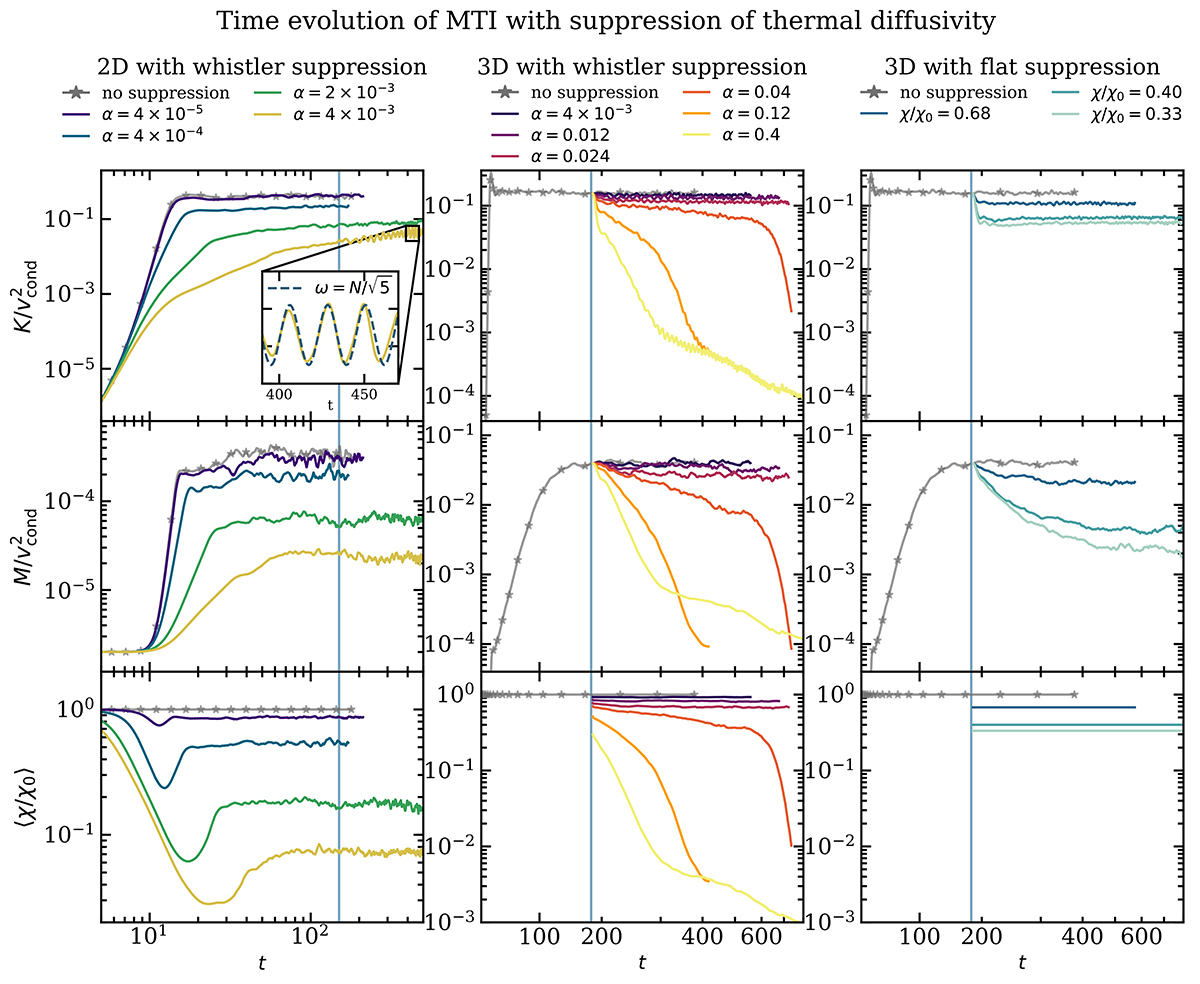
Time evolution of the MTI runs with whistler suppression of thermal diffusivity in 2D and in 3D (left and middle columns, respectively), and in 3D with flat suppression (right column). From top to bottom: Volume-averaged kinetic energy, magnetic energy, and average suppression factor as a function of time t measured in units of ωT−1. In 3D with whistler suppression, MTI turbulence decays if the suppression parameter α is large enough, while in 2D (where there can be no SSD) or in 3D with flat uniform suppression (with or without an SSD) MTI turbulence never dies completely. Left panel: The cyan vertical line at t = 150 indicates the time of the snapshots shown in Fig. 4. The inset in the top panel zooms in on the simulation with α = 4 × 10⁻³ (gold solid line) at late times, and shows periodic oscillations of frequency ![]() associated with a dominant large-scale g mode (kx, kz) = (1, 2)×2π/L. Middle and right panels: The cyan vertical line at t = 186 indicates the time when we turn on suppression of thermal diffusivity in our reference run.
associated with a dominant large-scale g mode (kx, kz) = (1, 2)×2π/L. Middle and right panels: The cyan vertical line at t = 186 indicates the time when we turn on suppression of thermal diffusivity in our reference run.
Current usage metrics show cumulative count of Article Views (full-text article views including HTML views, PDF and ePub downloads, according to the available data) and Abstracts Views on Vision4Press platform.
Data correspond to usage on the plateform after 2015. The current usage metrics is available 48-96 hours after online publication and is updated daily on week days.
Initial download of the metrics may take a while.