Open Access
Fig. 9.
Download original image
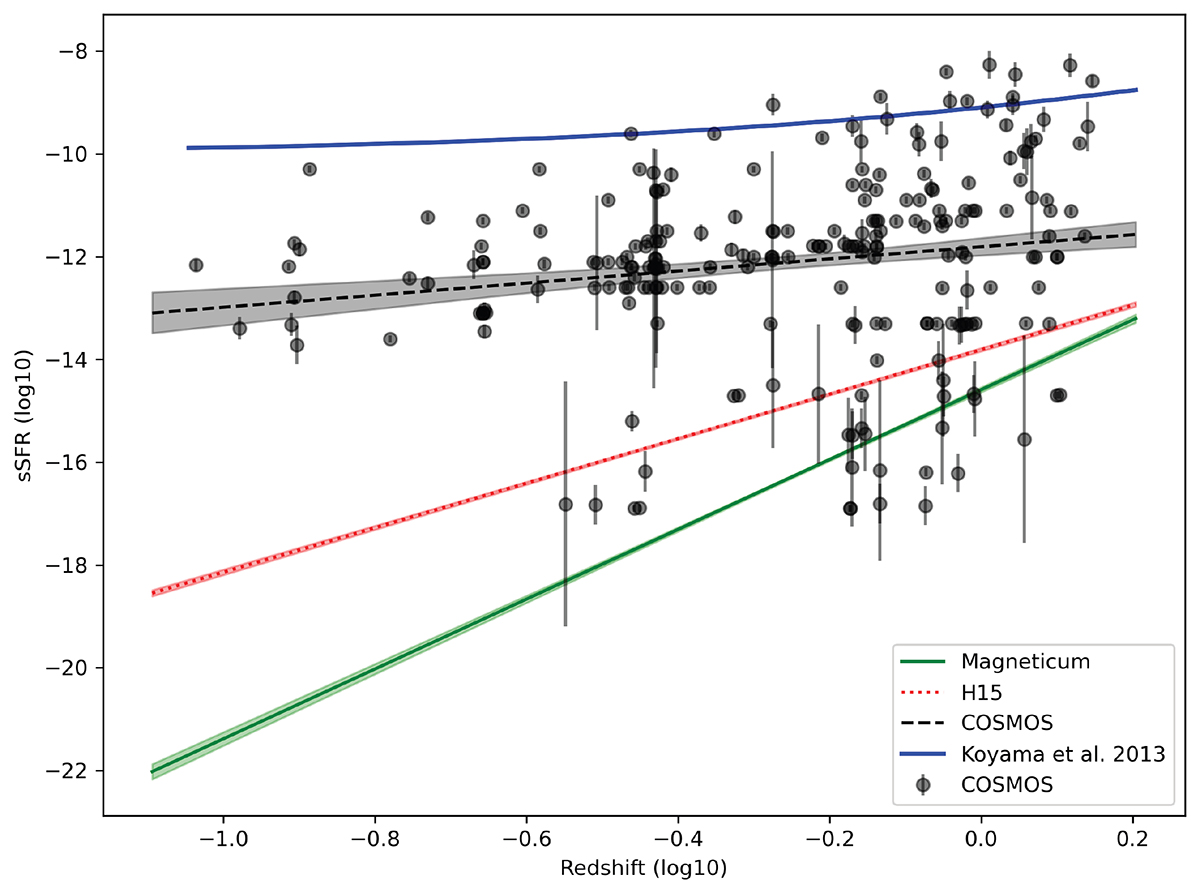
Specific SFR (sSFR) versus redshift for BGGs from COSMOS is shown using black filled circles and a black line, while the H15 SAM is represented with a red line, and the Magneticum simulation is plotted with a green line. The sSFR–redshift relation from Koyama et al. (2013) is illustrated using a blue line.
Current usage metrics show cumulative count of Article Views (full-text article views including HTML views, PDF and ePub downloads, according to the available data) and Abstracts Views on Vision4Press platform.
Data correspond to usage on the plateform after 2015. The current usage metrics is available 48-96 hours after online publication and is updated daily on week days.
Initial download of the metrics may take a while.