Fig. 6.
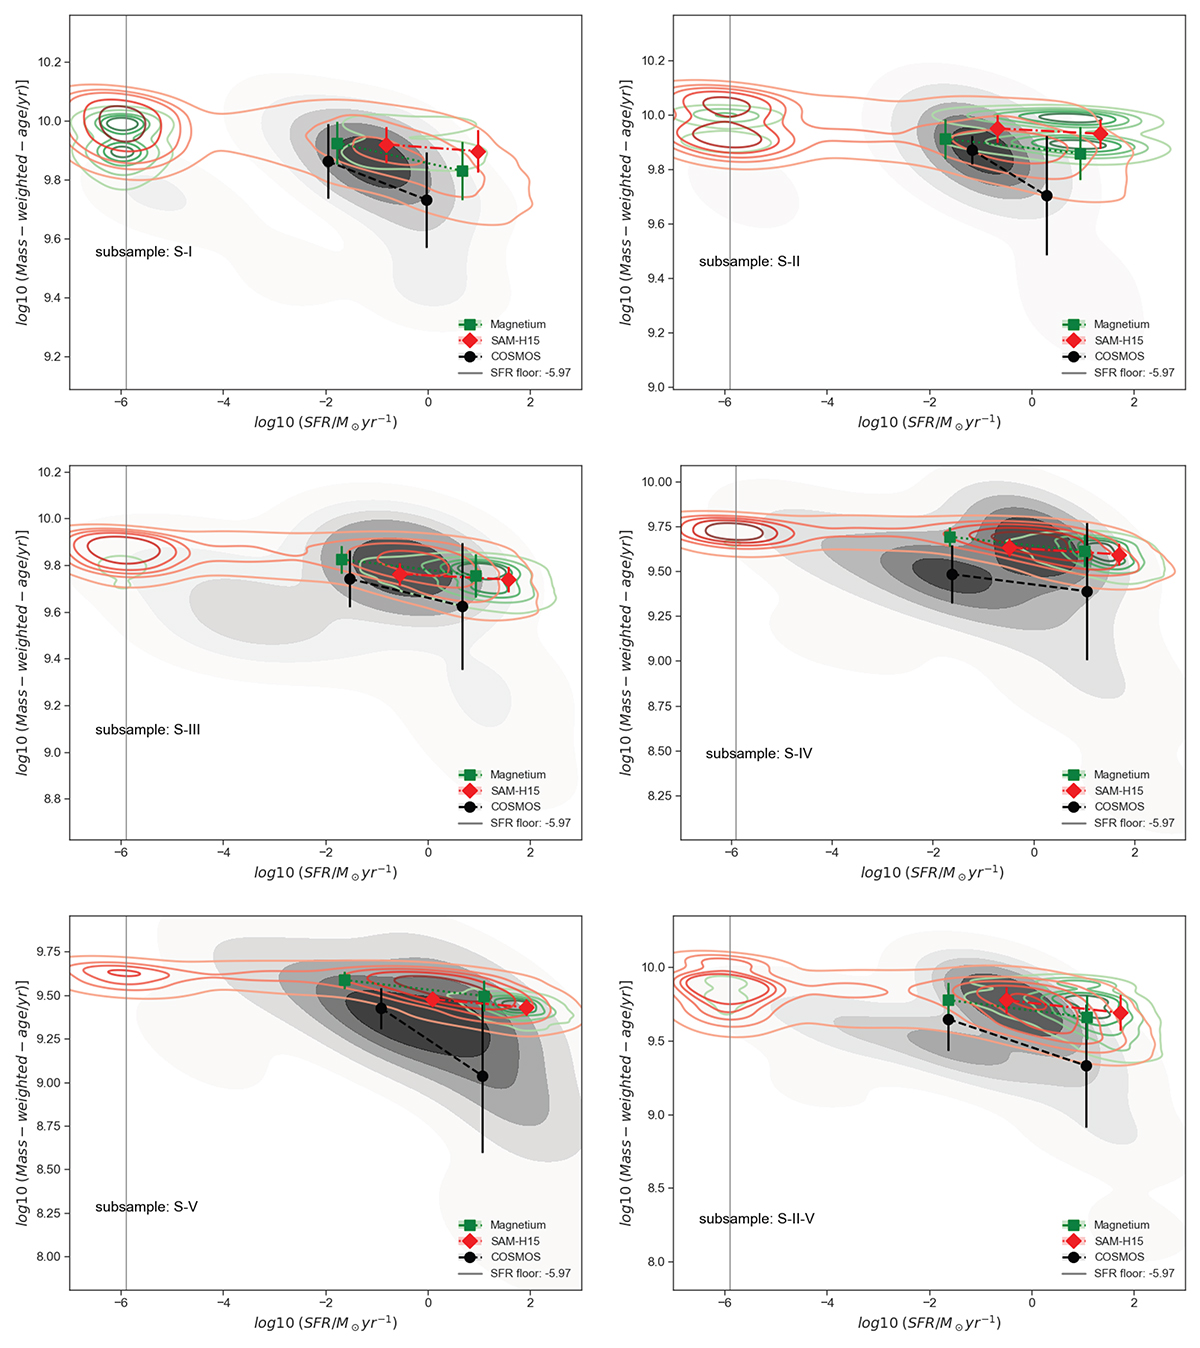
Download original image
log(Agew/yr) as a function of log(SFR/M⊙ yr−1) observed for BGGs in the S-I to S-V subsamples (KDE density map, shaded grey area). Red and green contours represent stellar age vs. stellar mass predictions by H15 and Magneticum. Median stellar age values in specific mass bins are indicated by black points (COSMOS), green diamonds (Magneticum), and red squares (H15). In the lower-right panel, we present the relationship between stellar age and stellar mass for a combined sample of BGGs within S-II to S-V. The vertical grey line marks log(SFR/M⊙ yr−1) = −5.97, the observed SFR threshold. In models, galaxies with SFR = 0 have been adjusted to the observed SFR threshold. For star forming BGGs, log(Agew/yr) shows a negative correlation with SFR with no significant evolution with increasing redshift, which is more pronounced in the observations compared to H15 and Magneticum simulation predictions.
Current usage metrics show cumulative count of Article Views (full-text article views including HTML views, PDF and ePub downloads, according to the available data) and Abstracts Views on Vision4Press platform.
Data correspond to usage on the plateform after 2015. The current usage metrics is available 48-96 hours after online publication and is updated daily on week days.
Initial download of the metrics may take a while.