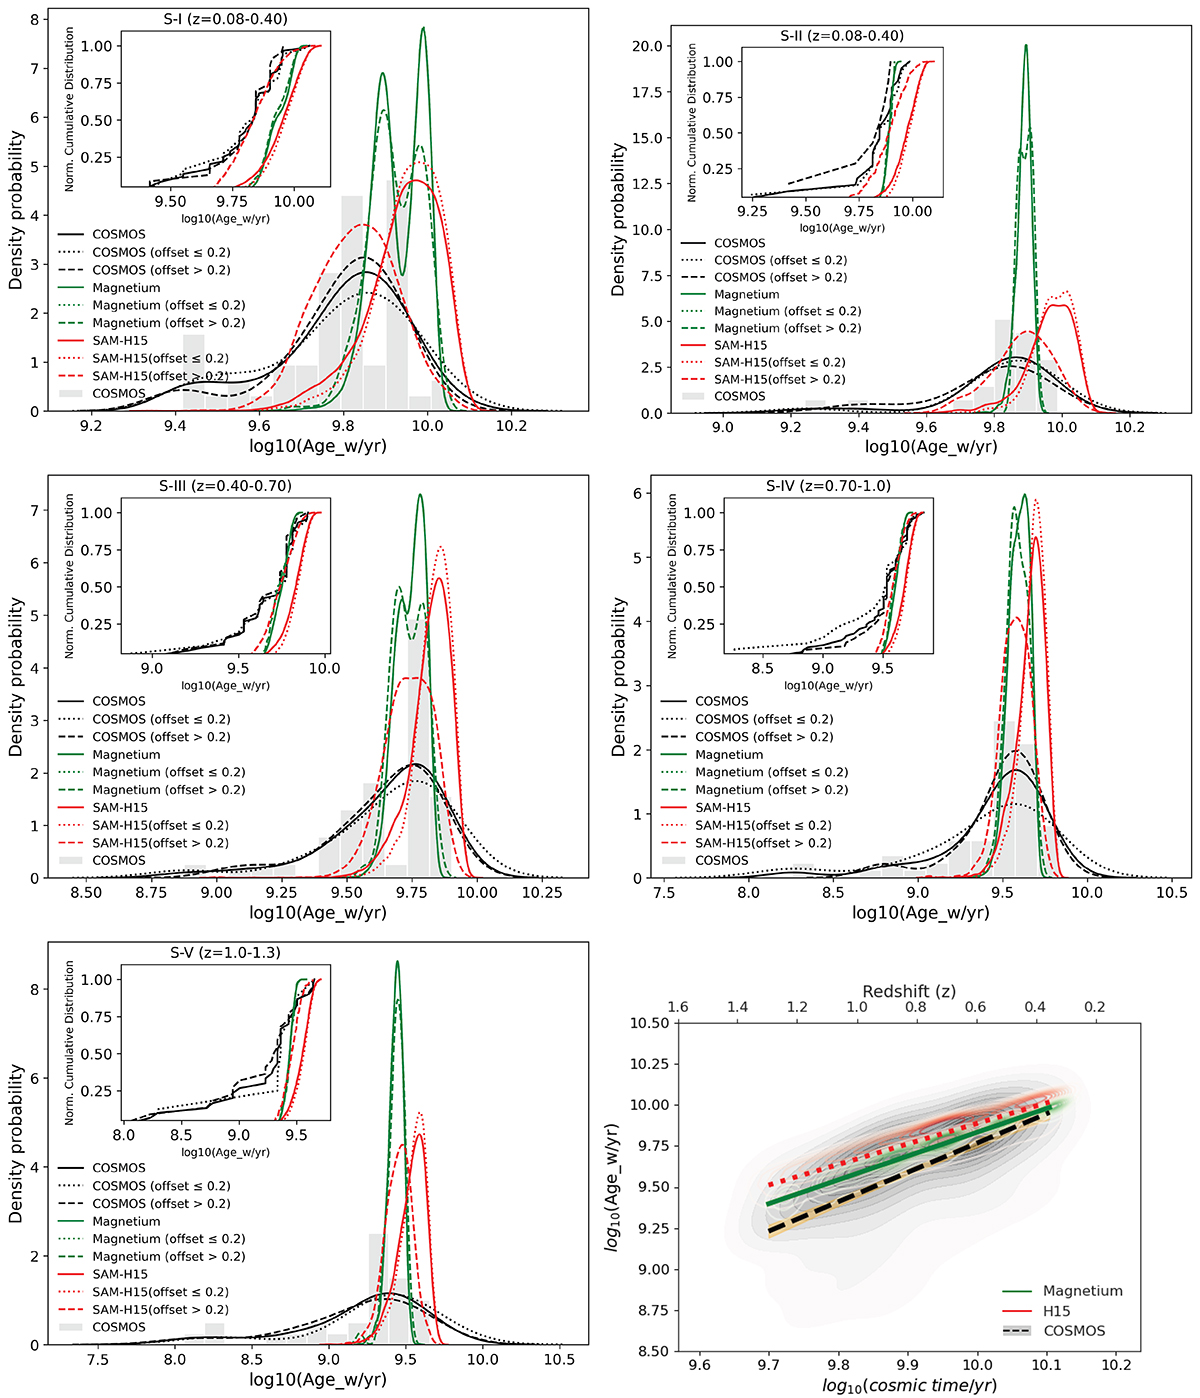
Fig. 3.
Download original image
Distribution of log (Agew/yr) of BGGs in the observations (COSMOS), Magneticum simulation, and H15 SAM. The smoothed KDE distributions for BGG subsamples are categorized by their proximity to the X-ray center. Those with an offset of ≤0.20R200 are represented by the dashed black curve. In contrast, those with an offset of > 0.20R200 are shown with a dotted black curve. The gray histogram represents the age distribution of all BGGs in COSMOS. To offer a comprehensive comparison, the smoothed stellar age distribution of BGGs predicted by H15 and Magneticum is portrayed with red and green lines, respectively. The bottom-right panel displays density maps of log(Agew/yr) over cosmic time for all BGGs in both observations and models. The cumulative distribution of the age of all BGGs, central dominants, and offset BGGs in the observations (COSMOS) and H15 SAM and the Magneticum simulation are displayed with similar colors and line styles within each panel of the figure as a subplot.
Current usage metrics show cumulative count of Article Views (full-text article views including HTML views, PDF and ePub downloads, according to the available data) and Abstracts Views on Vision4Press platform.
Data correspond to usage on the plateform after 2015. The current usage metrics is available 48-96 hours after online publication and is updated daily on week days.
Initial download of the metrics may take a while.