Open Access
Fig. 7
Download original image
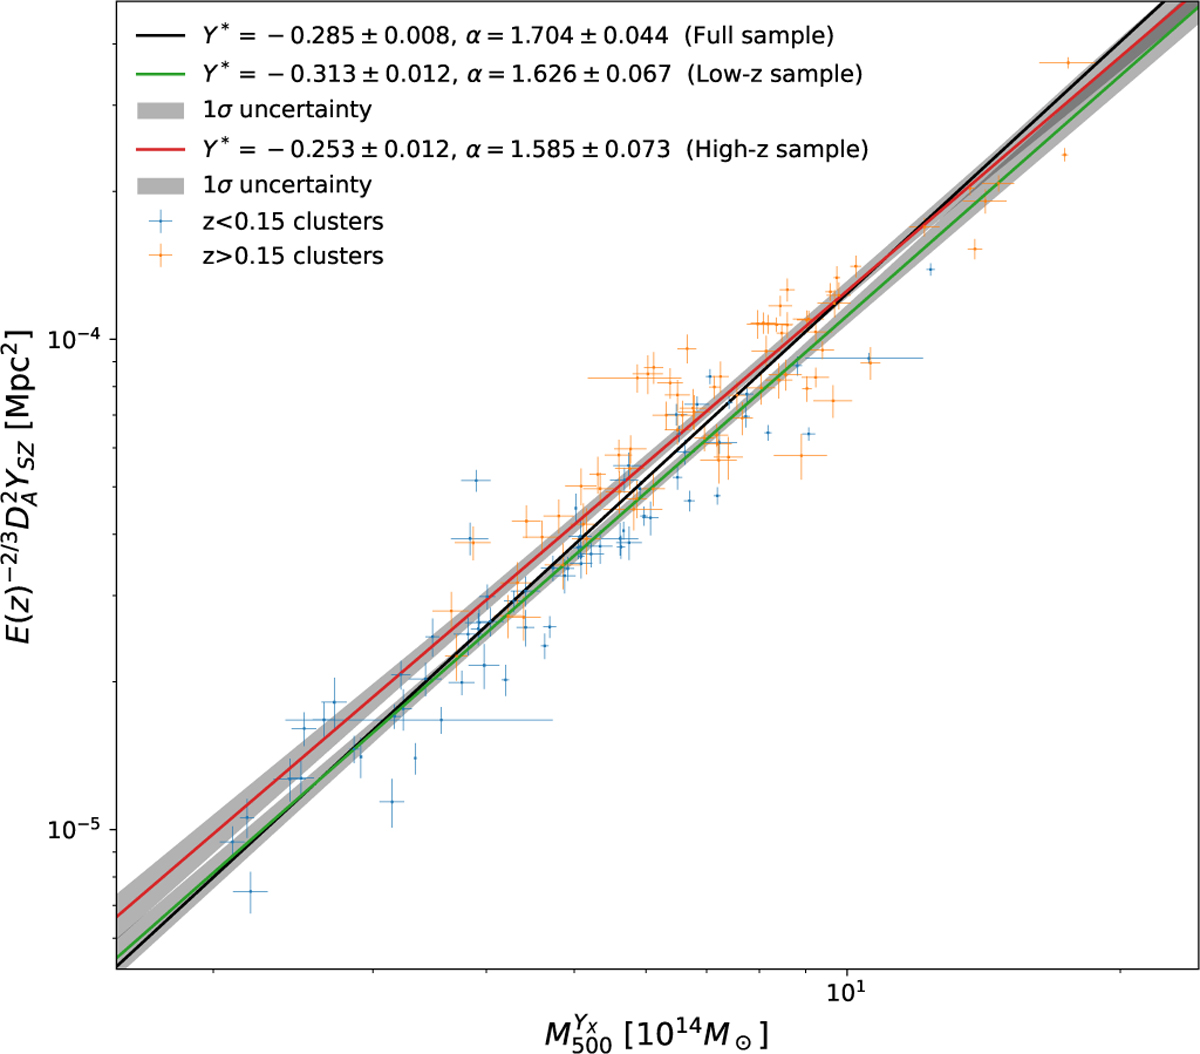
Calibration of the ![]() scaling relation for the high (best fit in red) and low (best fit in green) redshift subsamples. The black line shows the best-fit relation obtained previously on the full sample, and the grey contours correspond to 1σ uncertainties for each subsample fit.
scaling relation for the high (best fit in red) and low (best fit in green) redshift subsamples. The black line shows the best-fit relation obtained previously on the full sample, and the grey contours correspond to 1σ uncertainties for each subsample fit.
Current usage metrics show cumulative count of Article Views (full-text article views including HTML views, PDF and ePub downloads, according to the available data) and Abstracts Views on Vision4Press platform.
Data correspond to usage on the plateform after 2015. The current usage metrics is available 48-96 hours after online publication and is updated daily on week days.
Initial download of the metrics may take a while.