Fig. 6
Download original image
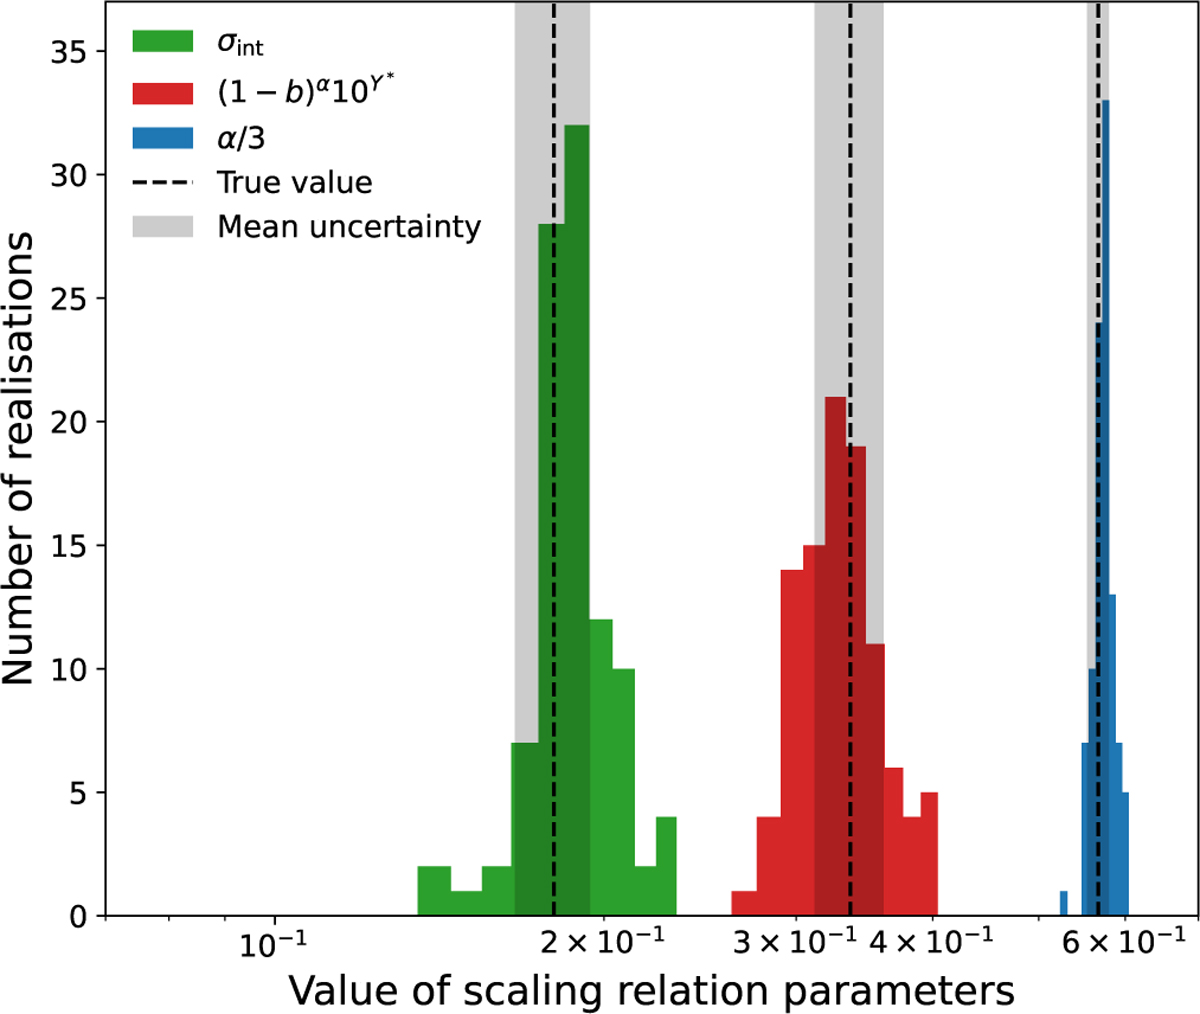
Retrieved YSZ − M500 scaling relation on 100 synthetic calibration samples compared with the true underlying relation used for sample generation. The retrieved slope (divided by three for better readability) is shown in blue, the retrieved intrinsic scatter in green, and the relevant combination of the degenerated parameters (1 − b) and Y* in red. The true value of each parameter is shown by the black dashed lines and the mean uncertainty returned by the calibration procedure is shown by the grey contours.
Current usage metrics show cumulative count of Article Views (full-text article views including HTML views, PDF and ePub downloads, according to the available data) and Abstracts Views on Vision4Press platform.
Data correspond to usage on the plateform after 2015. The current usage metrics is available 48-96 hours after online publication and is updated daily on week days.
Initial download of the metrics may take a while.