Fig. 2
Download original image
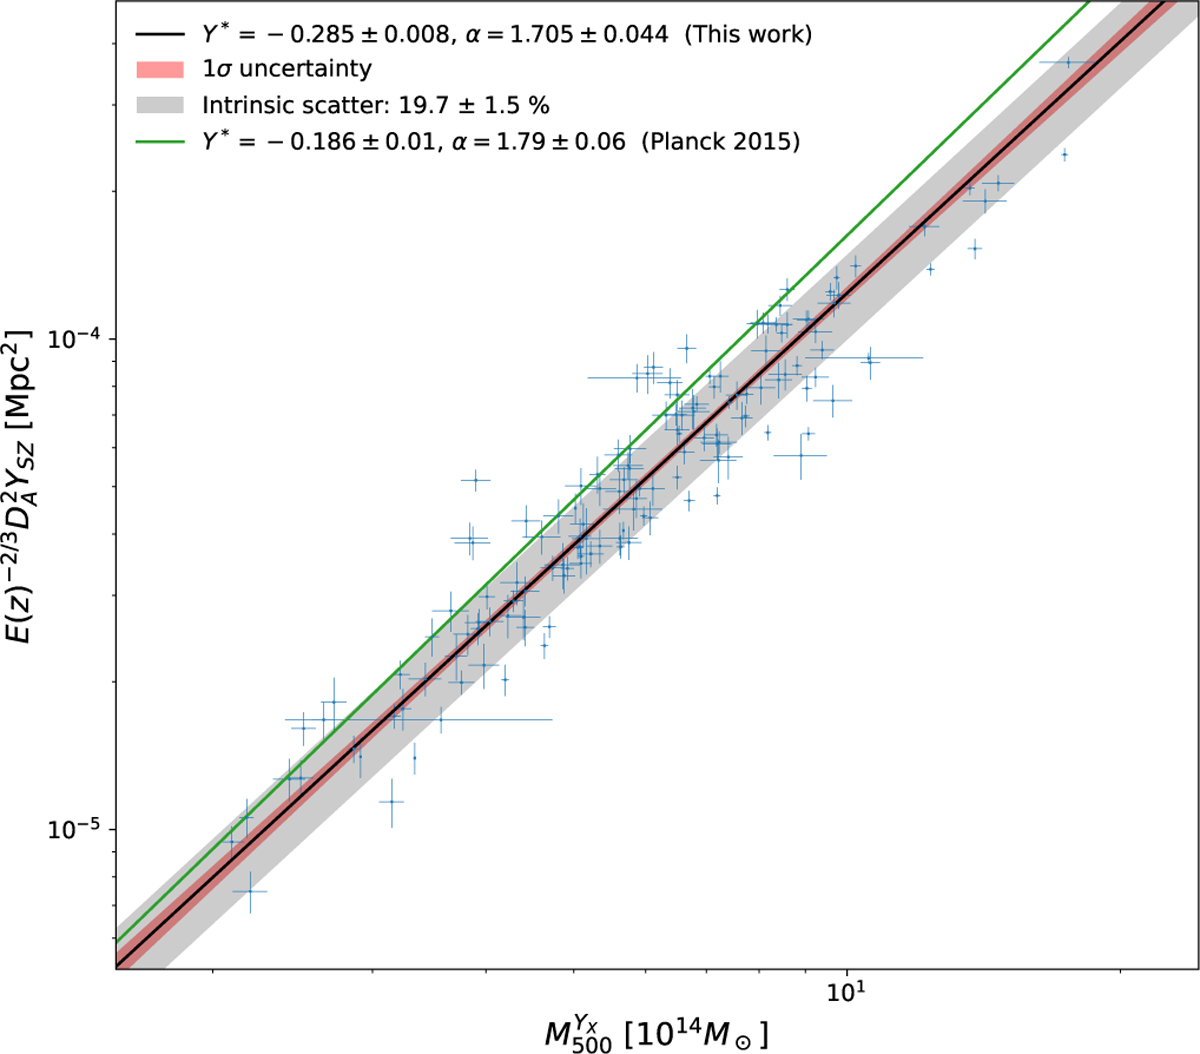
Calibration of the ![]() scaling relation. The blue dots correspond to the X-ray mass and SZ signal (with 1σ uncertainties) for each cluster in the sample. The black line shows the best-fit relation obtained in this work, with the red regions corresponding to 1σ uncertainties, the grey regions to the intrinsic scatter, and the green line to the best-fit relation obtained in Planck Collaboration XX (2014).
scaling relation. The blue dots correspond to the X-ray mass and SZ signal (with 1σ uncertainties) for each cluster in the sample. The black line shows the best-fit relation obtained in this work, with the red regions corresponding to 1σ uncertainties, the grey regions to the intrinsic scatter, and the green line to the best-fit relation obtained in Planck Collaboration XX (2014).
Current usage metrics show cumulative count of Article Views (full-text article views including HTML views, PDF and ePub downloads, according to the available data) and Abstracts Views on Vision4Press platform.
Data correspond to usage on the plateform after 2015. The current usage metrics is available 48-96 hours after online publication and is updated daily on week days.
Initial download of the metrics may take a while.