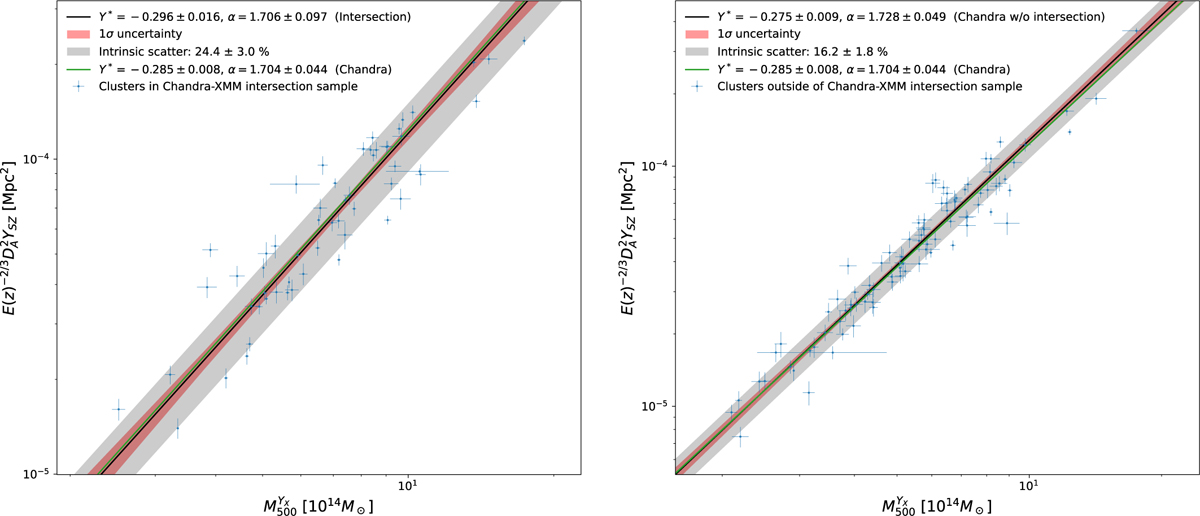
Fig. D.4
Download original image
Scaling relations obtained when including or excluding clusters of the XMM-Newton sample. Left: Comparison of the scaling relation obtained with the Chandra sample restricted to the 56 clusters present in both Chandra and XMM-Newton samples (black line with uncertainty and intrinsic scatter) and the relation obtained with the full Chandra sample (green line). Right: Comparison of the scaling relation obtained with the Chandra sample restricted to the 110 clusters present in the Chandra sample and absent from the XMM-Newton sample (black line with uncertainty and intrinsic scatter) and the relation obtained with the full Chandra sample (green line).
Current usage metrics show cumulative count of Article Views (full-text article views including HTML views, PDF and ePub downloads, according to the available data) and Abstracts Views on Vision4Press platform.
Data correspond to usage on the plateform after 2015. The current usage metrics is available 48-96 hours after online publication and is updated daily on week days.
Initial download of the metrics may take a while.