Open Access
Fig. D.3
Download original image
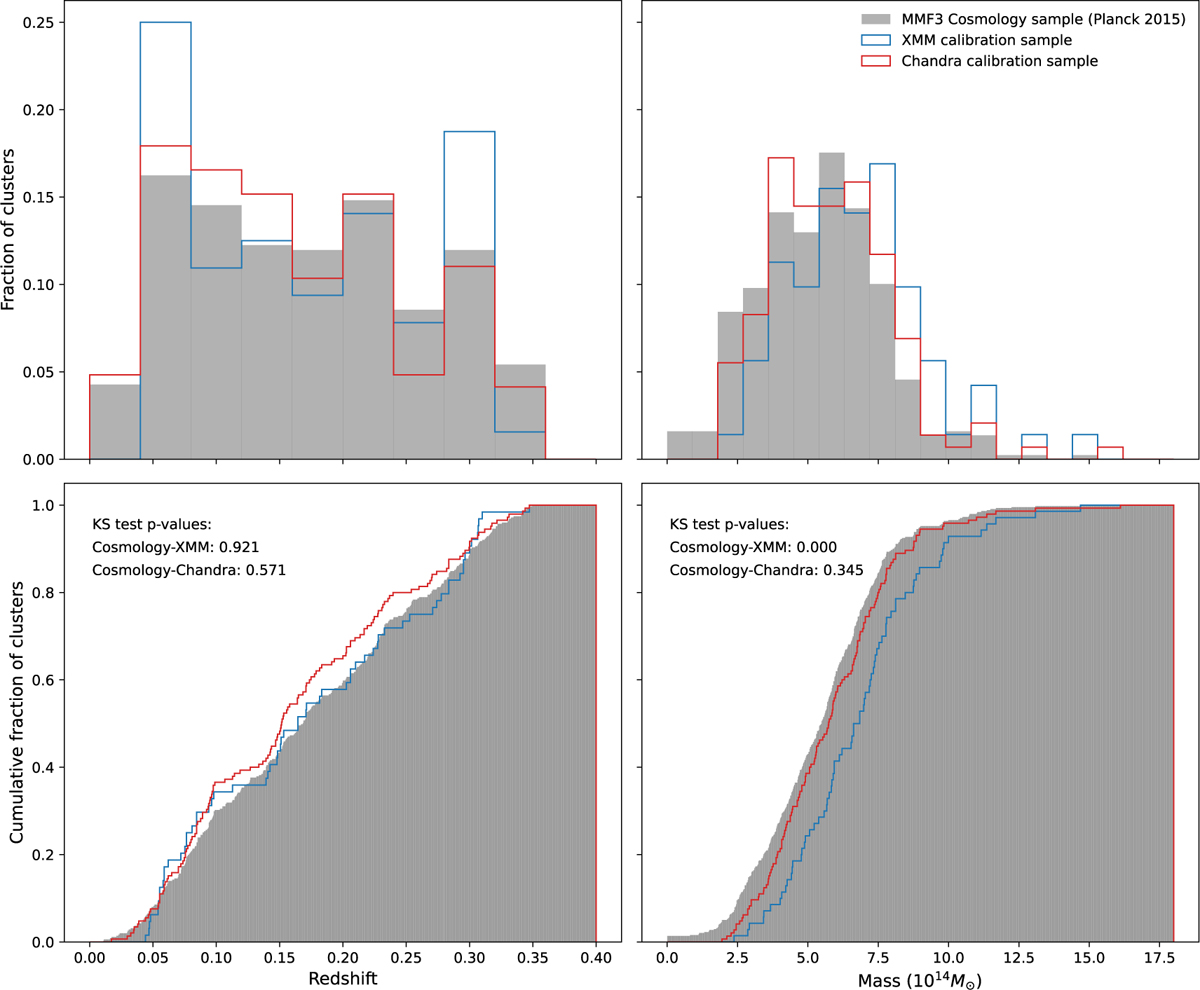
Comparison of the redshift (left side) and mass (right side) distributions of the XMM-Newton sample (in blue) and the Chandra sample (in red) with the Planck cosmology sample. The p-values obtained when performing a KS-test comparing each calibration sample with the cosmology sample is reported in the bottom panels.
Current usage metrics show cumulative count of Article Views (full-text article views including HTML views, PDF and ePub downloads, according to the available data) and Abstracts Views on Vision4Press platform.
Data correspond to usage on the plateform after 2015. The current usage metrics is available 48-96 hours after online publication and is updated daily on week days.
Initial download of the metrics may take a while.