Open Access
Fig. 10
Download original image
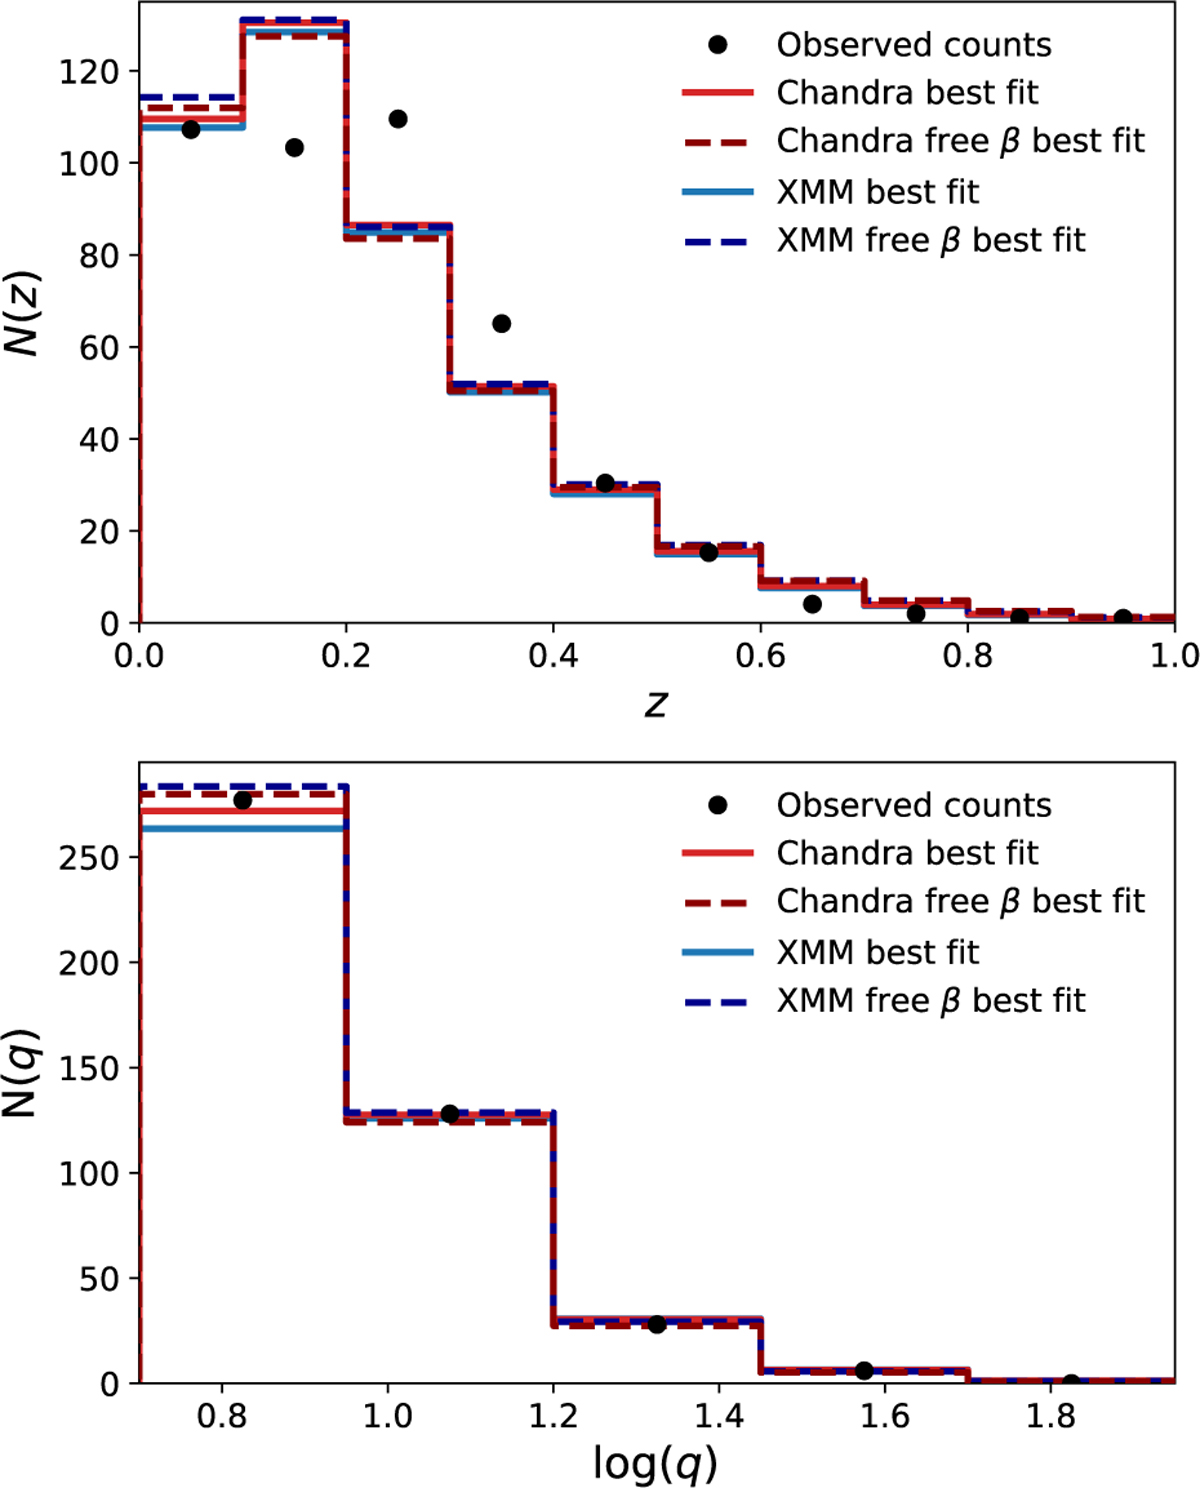
Redshift (top panel) and signal-to-noise (bottom panel) distribution of best-fit models from the four analysis cases presented in this work. The observed counts in the PSZ2 catalogue (q > 6) are plotted as the black points.
Current usage metrics show cumulative count of Article Views (full-text article views including HTML views, PDF and ePub downloads, according to the available data) and Abstracts Views on Vision4Press platform.
Data correspond to usage on the plateform after 2015. The current usage metrics is available 48-96 hours after online publication and is updated daily on week days.
Initial download of the metrics may take a while.