Open Access
Fig. 9.
Download original image
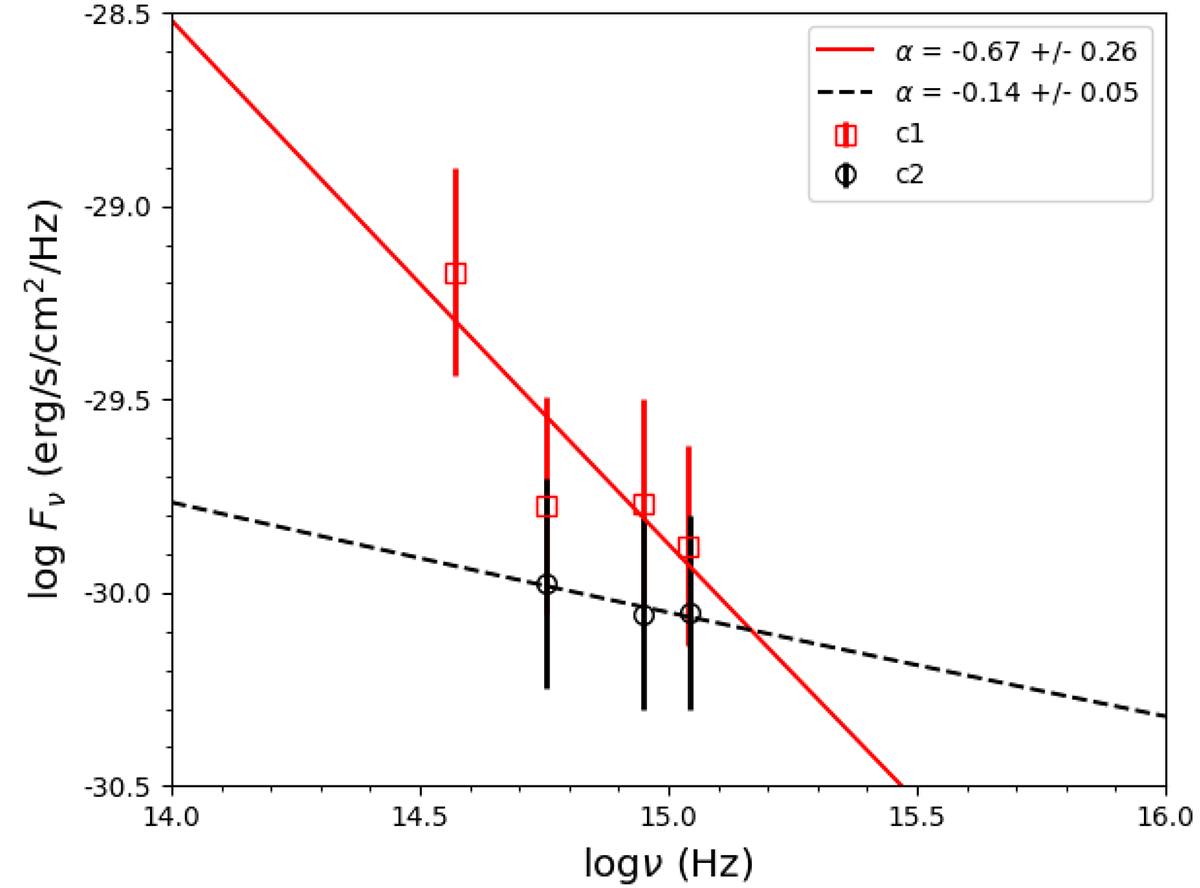
Spectral energy distributions of the optical counterpart candidates for X-1. The c1 and c2 data are given as red squares and black circles, respectively. The SED models for c1 and c2 are shown as red solid and black dashed lines, respectively. The power-law indexes are α = −0.67 ± 0.26 for c1 and α = −0.14 ± 0.05 for c2.
Current usage metrics show cumulative count of Article Views (full-text article views including HTML views, PDF and ePub downloads, according to the available data) and Abstracts Views on Vision4Press platform.
Data correspond to usage on the plateform after 2015. The current usage metrics is available 48-96 hours after online publication and is updated daily on week days.
Initial download of the metrics may take a while.