Open Access
Fig. 5.
Download original image
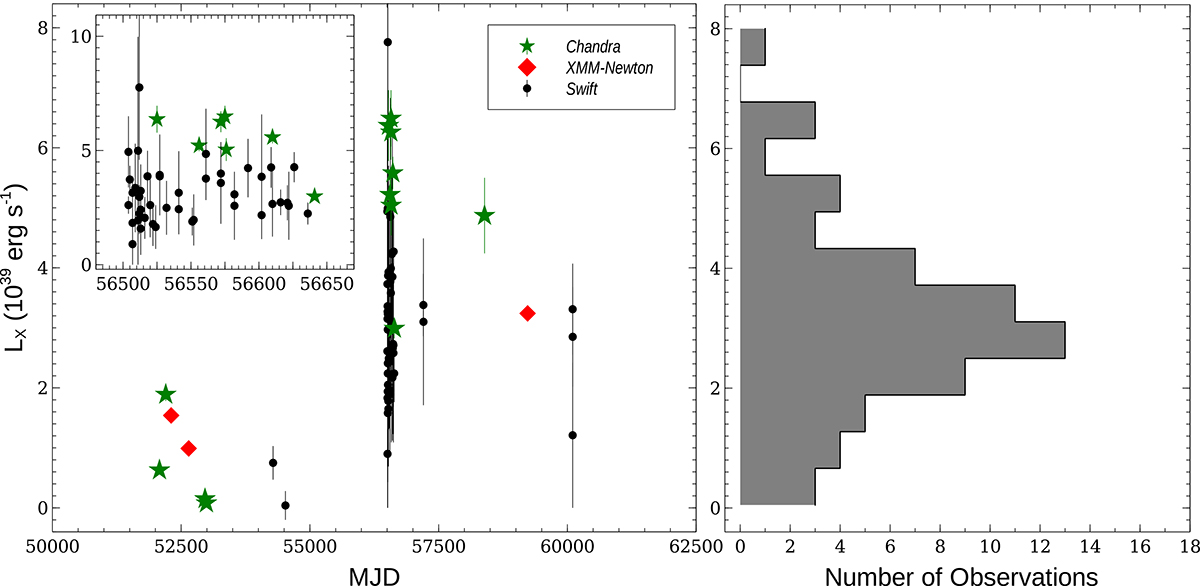
Long-term light curve (left) and the histogram of the derived luminosities (right) of X-1 using the Chandra, XMM-Newton, and Swift data. The luminosity values were calculated in the 0.3−10.0 keV energy band. The inner panel in the light curve was given to separate the Chandra and Swift data for clarity.
Current usage metrics show cumulative count of Article Views (full-text article views including HTML views, PDF and ePub downloads, according to the available data) and Abstracts Views on Vision4Press platform.
Data correspond to usage on the plateform after 2015. The current usage metrics is available 48-96 hours after online publication and is updated daily on week days.
Initial download of the metrics may take a while.