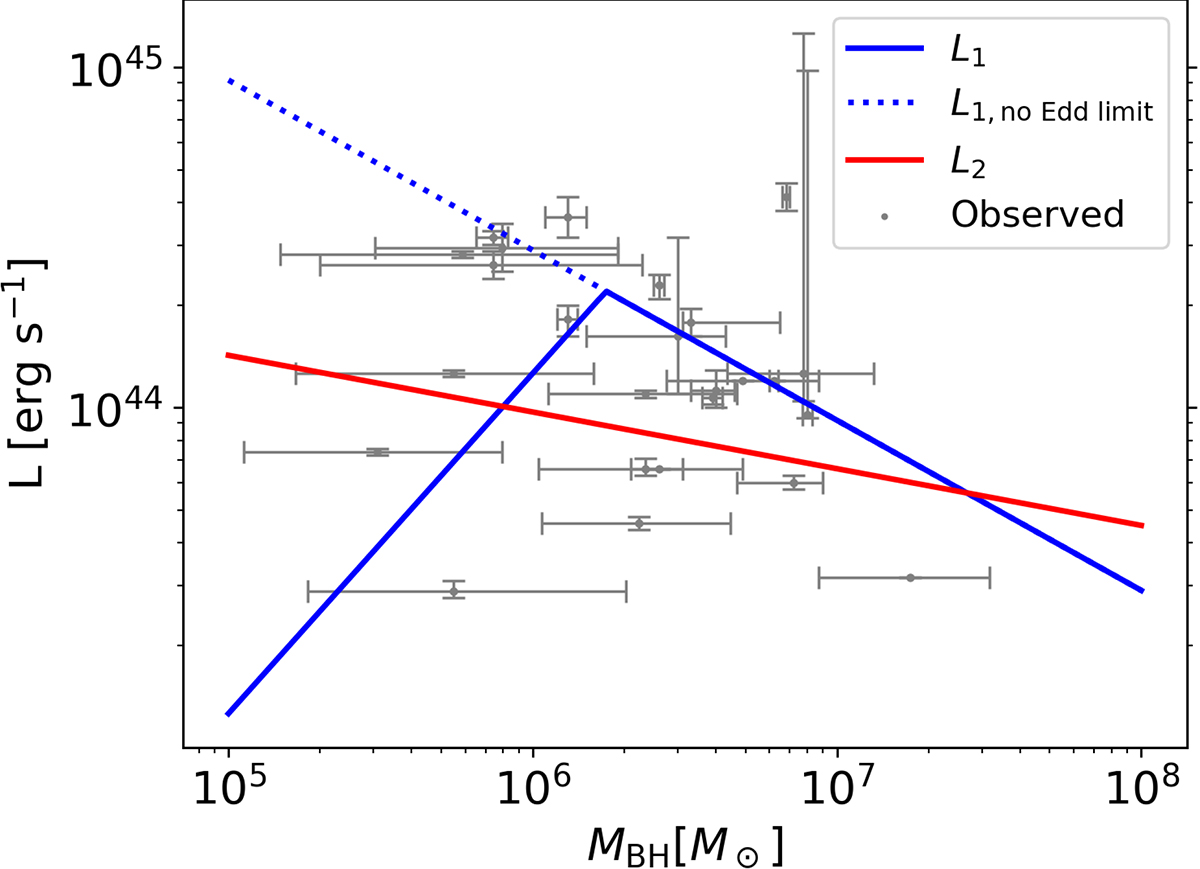
Fig. 2.
Download original image
Two luminosities of TDEs, L1 (Eq. (6), Thomsen et al. 2022) and L2 (Eq. (7), Ryu et al. 2020b) as a function of MBH overlaid with observed optical TDEs using gray dots and error bars (see Table A.1 in Wong et al. 2022 and Table 1 in Ryu et al. 2020b, and references therein). The dotted blue line conveys L1 as given by Eq. (6), whereas the solid blue line show the Eddington limited L1.
Current usage metrics show cumulative count of Article Views (full-text article views including HTML views, PDF and ePub downloads, according to the available data) and Abstracts Views on Vision4Press platform.
Data correspond to usage on the plateform after 2015. The current usage metrics is available 48-96 hours after online publication and is updated daily on week days.
Initial download of the metrics may take a while.