Open Access
Fig. C.1.
Download original image
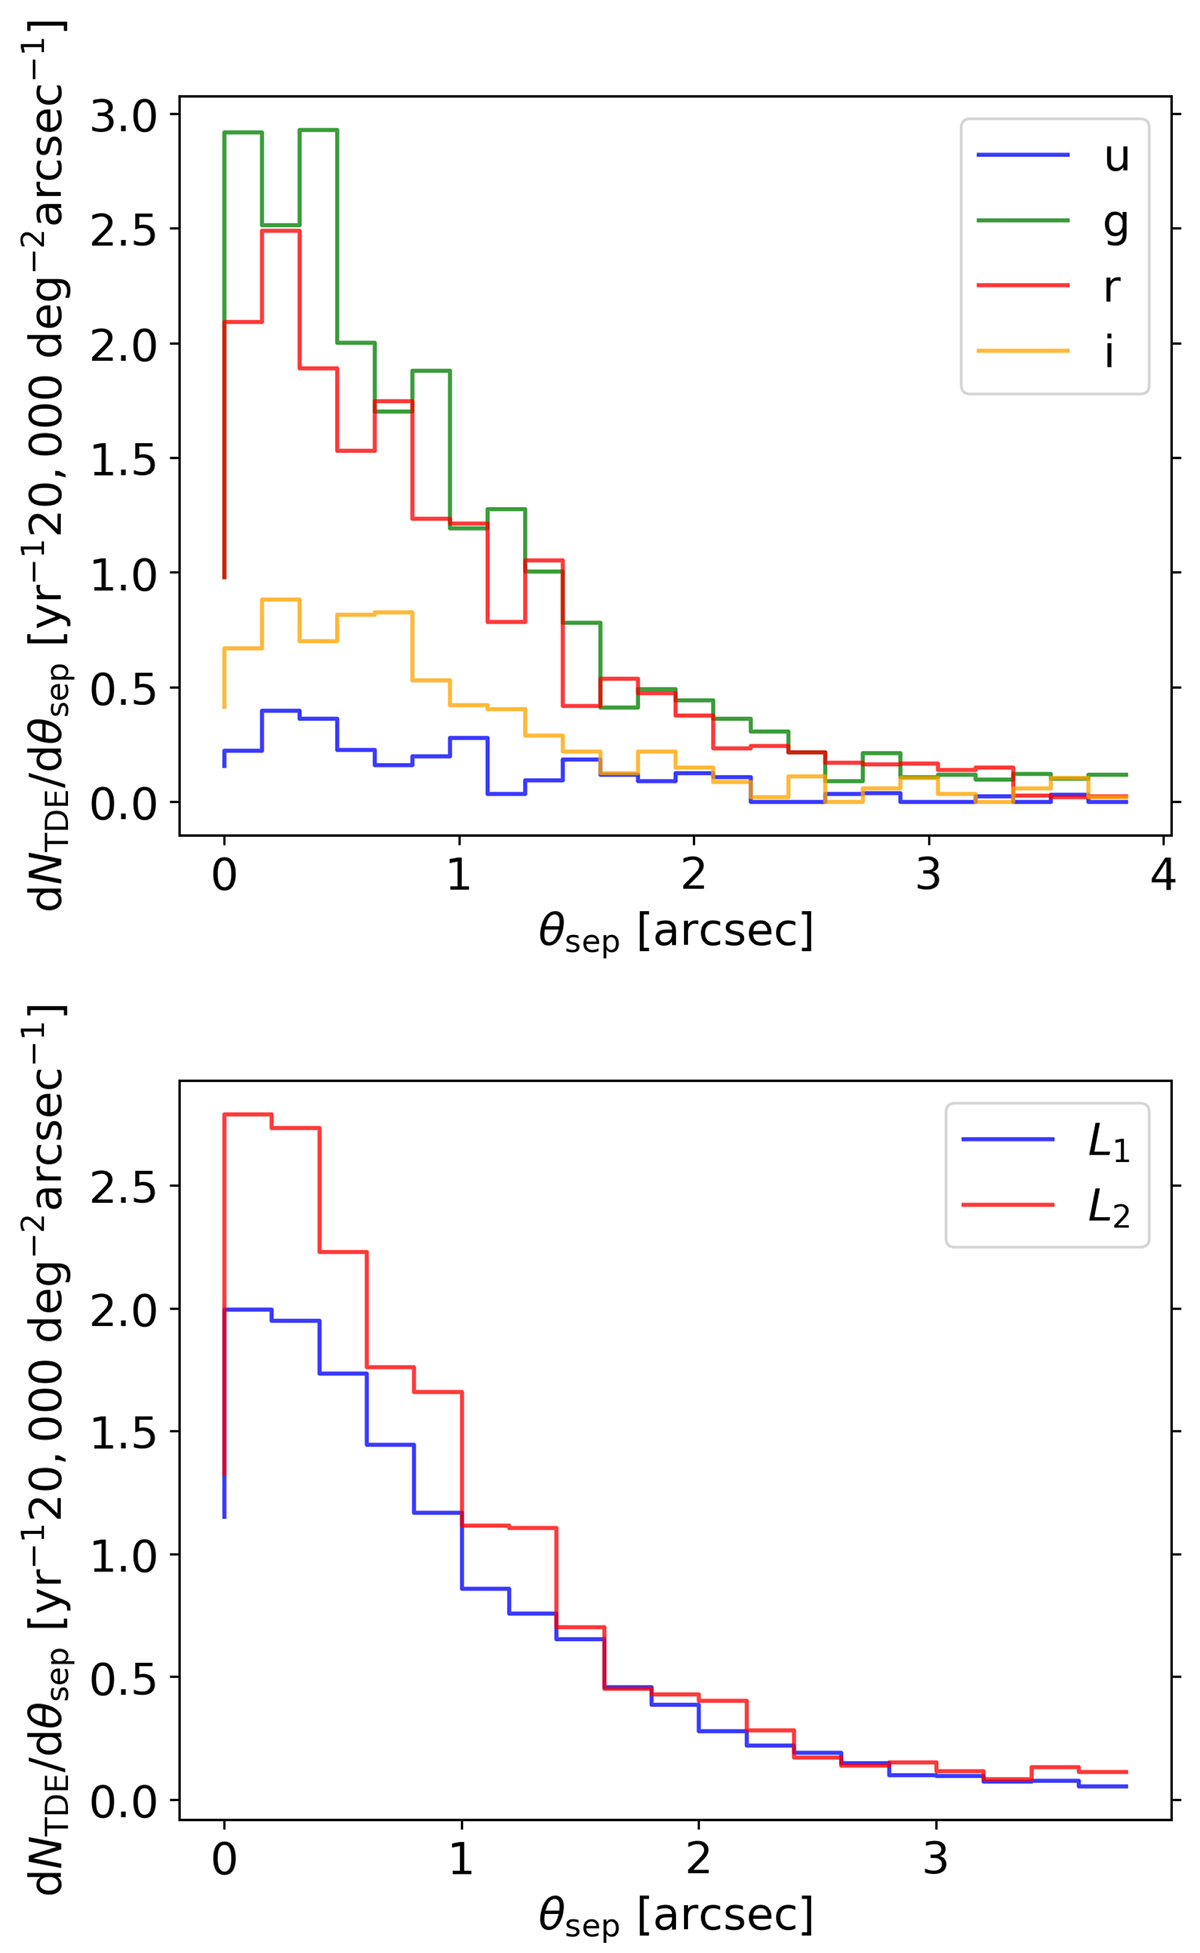
Lensed TDE image separation distributions assuming LSST1 magnitude cutoffs without the condition that θsep > 0.5″. The top panel shows the distributions for all four bands for L2, and the bottom panel shows the g band distributions for L1 and L2.
Current usage metrics show cumulative count of Article Views (full-text article views including HTML views, PDF and ePub downloads, according to the available data) and Abstracts Views on Vision4Press platform.
Data correspond to usage on the plateform after 2015. The current usage metrics is available 48-96 hours after online publication and is updated daily on week days.
Initial download of the metrics may take a while.