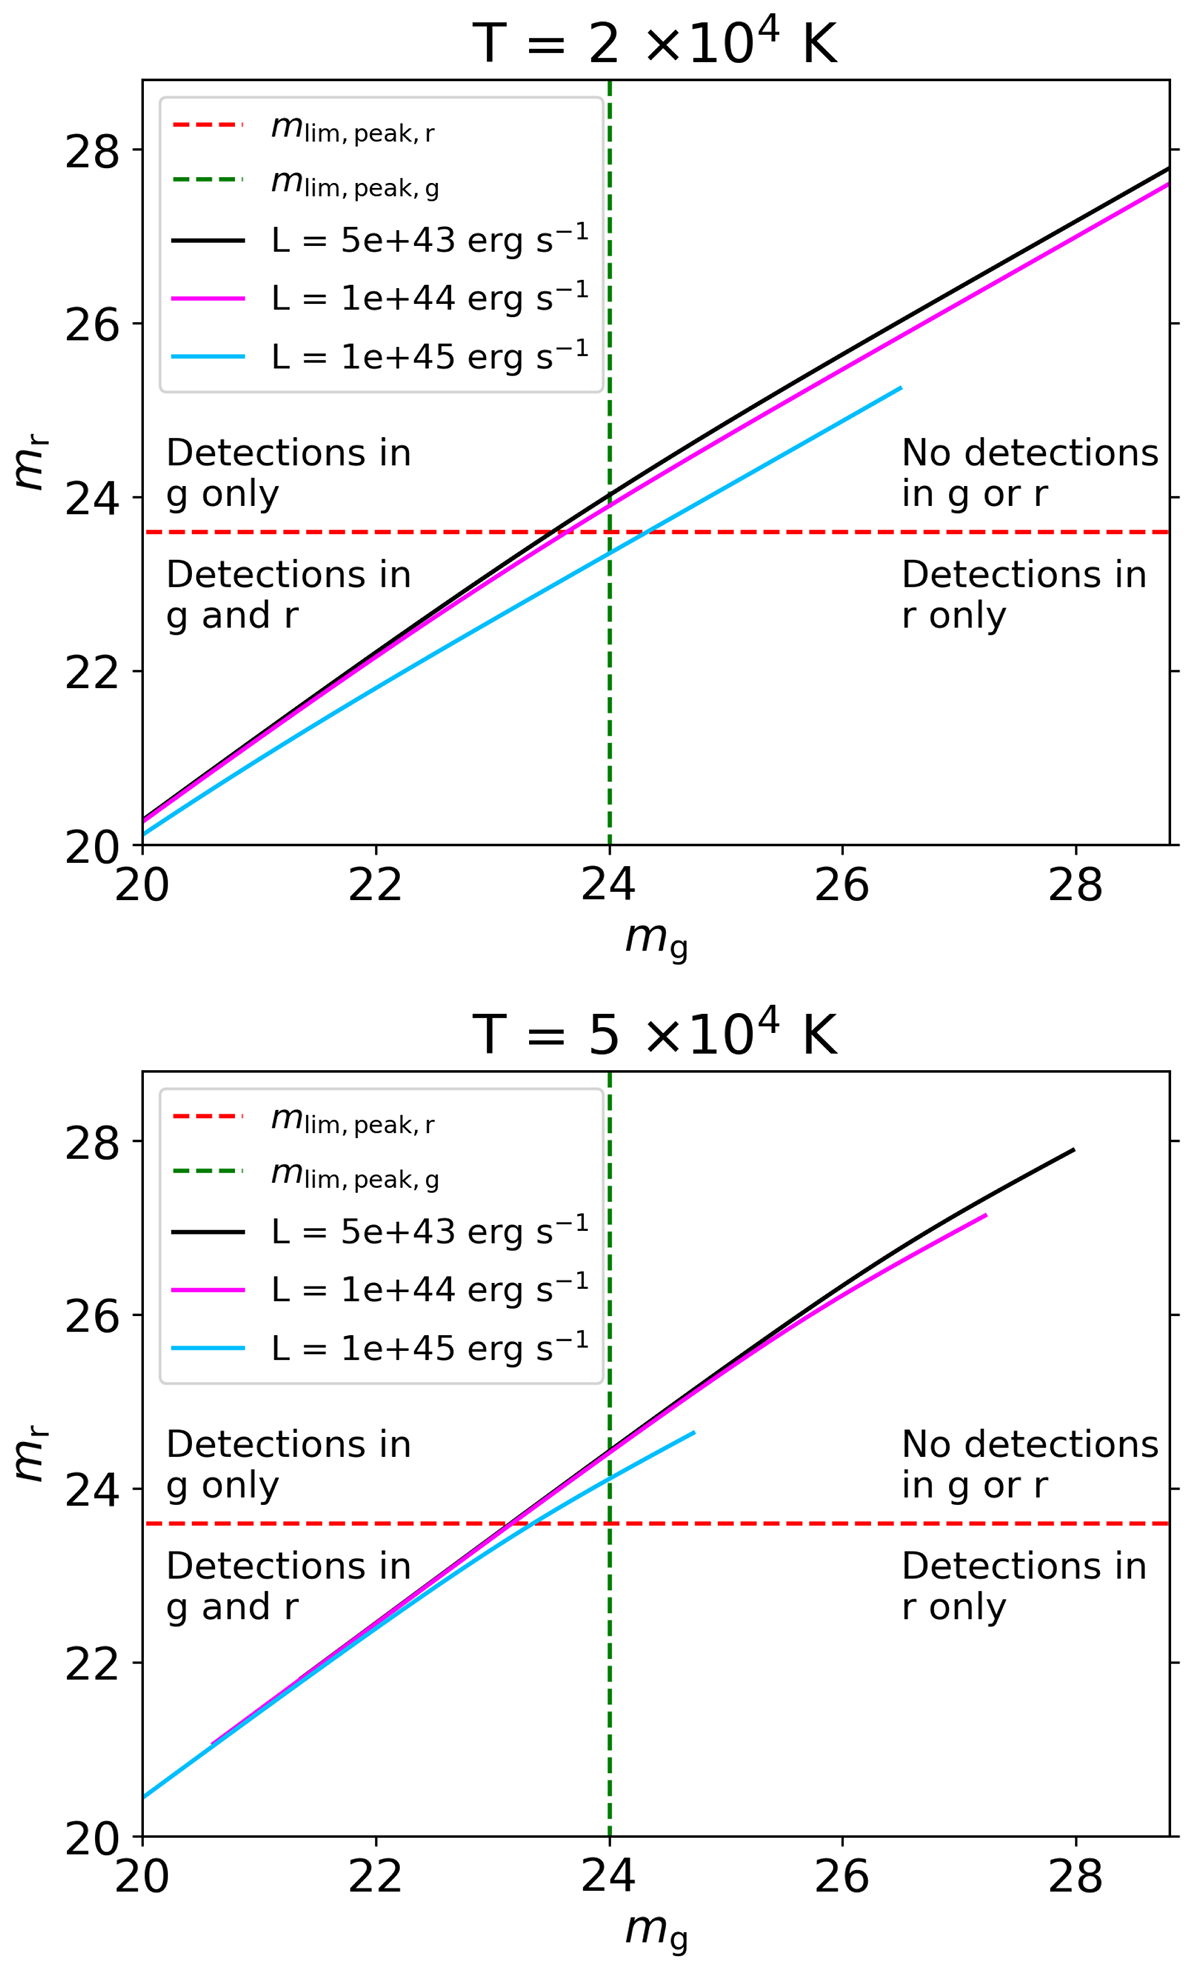
Fig. B.1.
Download original image
Unlensed magnitude relationship between r and g bands at T = 2 and 5 × 10⁴ K. Assuming a redshift range of z = 0.1 − 5, three luminosity cases of L = 5 × 1043, 1 × 1044 and 1 × 1045 erg s−1 are shown to represent the luminosity span across L1 and L2, and the mlim, peak values for r and g bands are given by the red and green dashed lines, respectively.
Current usage metrics show cumulative count of Article Views (full-text article views including HTML views, PDF and ePub downloads, according to the available data) and Abstracts Views on Vision4Press platform.
Data correspond to usage on the plateform after 2015. The current usage metrics is available 48-96 hours after online publication and is updated daily on week days.
Initial download of the metrics may take a while.