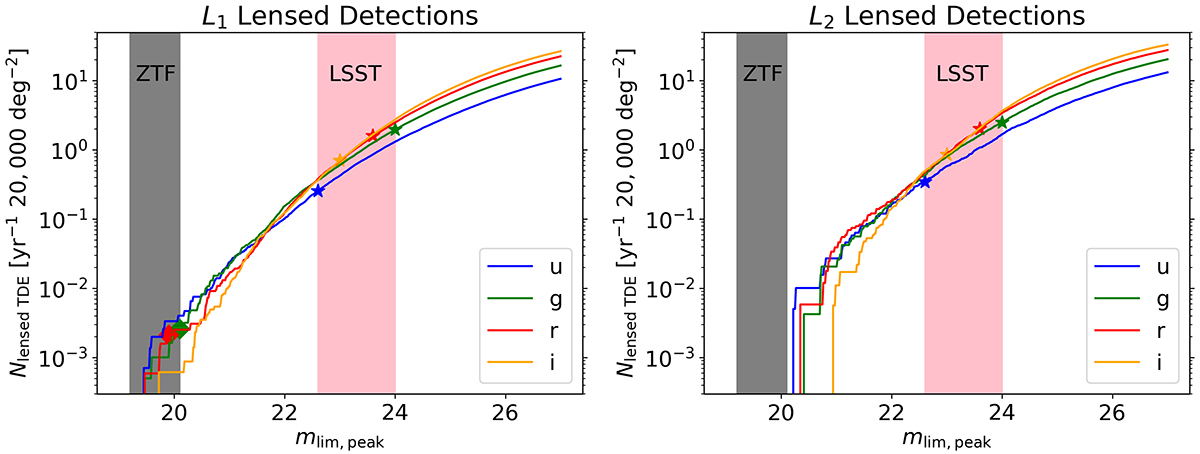
Fig. 12.
Download original image
Strongly lensed L1 (left panel) and L2 (right panel) detection rates per effective year of observation for u, g, r and i bands assuming a variable peak magnitude, mlim, peak. The mlim, peak ranges for ZTF and LSST1 assuming a survey area of 20 000 deg2 are shown in gray and pink, respectively. The LSST1 mlim, peak values for each of the four bands are overlaid along the curves in stars, and the ZTF mlim, peak values for g, r and i are overlaid along the curves in diamonds.
Current usage metrics show cumulative count of Article Views (full-text article views including HTML views, PDF and ePub downloads, according to the available data) and Abstracts Views on Vision4Press platform.
Data correspond to usage on the plateform after 2015. The current usage metrics is available 48-96 hours after online publication and is updated daily on week days.
Initial download of the metrics may take a while.