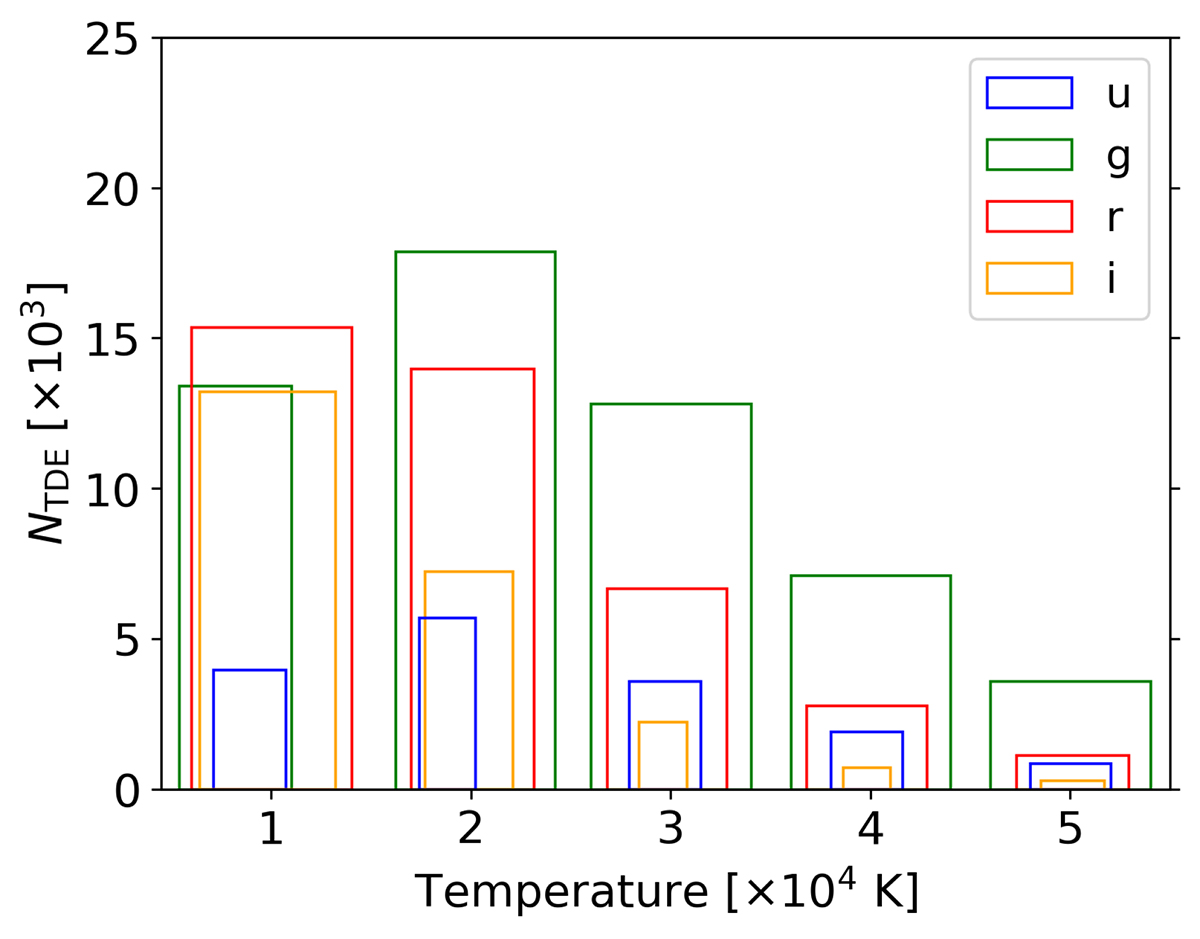
Fig. 10.
Download original image
Number and hierarchy of unlensed L1 detections for each of the four bands across the five temperatures we consider given LSST1 magnitude cutoffs. The band that results in the most detections for each temperature is the tallest rectangle (i.e., the r band for T = 1 × 10⁴ K and g band for all other temperatures) where the height of the rectangle indicates the number of detections, and a rectangle contained within another implies that a detection in that band is also detected in the encompassing band. For instance, in the T = 3 × 10⁴ K case, the yellow rectangle for i band is contained entirely within the green, red and blue rectangles for g, r and u bands, respectively. This indicates that all i band detections are also detected within g, r and u bands. The partial overlapping for T = 1 × 10⁴ K (g and i) and 2 × 10⁴ K (u and i) means those detections do not establish a full hierarchy. Note that the width and the degree of overlap of the rectangles do not convey any significant meaning.
Current usage metrics show cumulative count of Article Views (full-text article views including HTML views, PDF and ePub downloads, according to the available data) and Abstracts Views on Vision4Press platform.
Data correspond to usage on the plateform after 2015. The current usage metrics is available 48-96 hours after online publication and is updated daily on week days.
Initial download of the metrics may take a while.