Fig. 9
Download original image
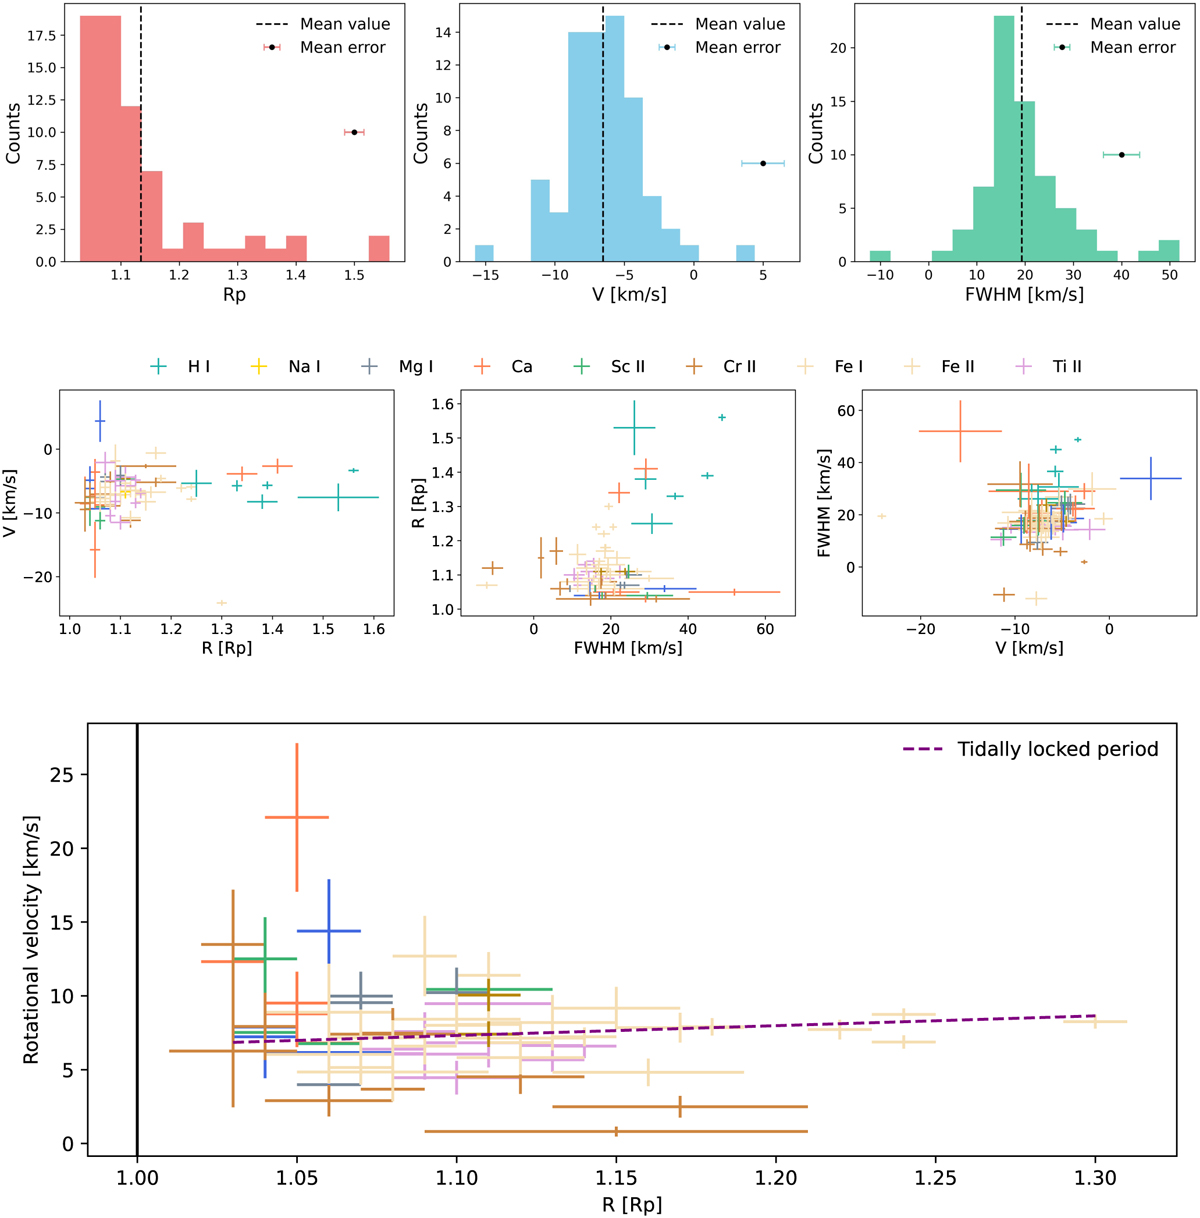
Analysis of Gaussian best-fit parameters of all detected lines. Top panel: histograms of height, velocity, and FWHM. Middle panel: relations between velocity, height, and FWHM. Bottom panel: rotational velocity against the height in the atmosphere (in planetary radii); the dashed purple line represents the profile expected for the tidally locked scenario, while the black line represents the planetary radius.
Current usage metrics show cumulative count of Article Views (full-text article views including HTML views, PDF and ePub downloads, according to the available data) and Abstracts Views on Vision4Press platform.
Data correspond to usage on the plateform after 2015. The current usage metrics is available 48-96 hours after online publication and is updated daily on week days.
Initial download of the metrics may take a while.