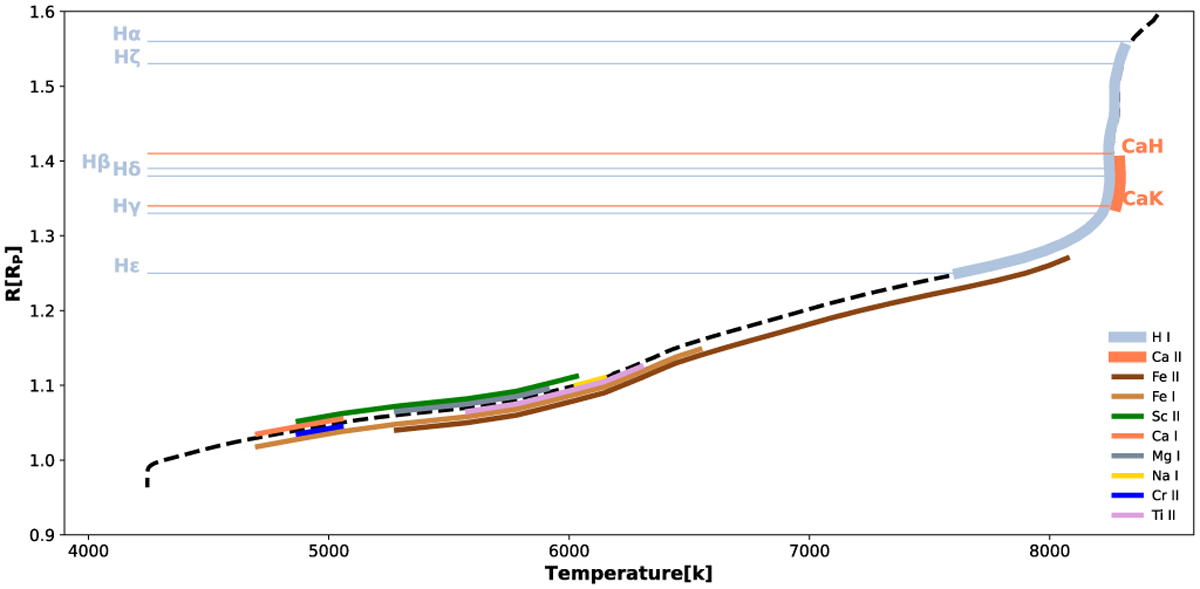
Fig. 7
Download original image
Height distribution of chemical species detected expressed in planetary radii as a function of atmospheric temperature. H I and Ca II lie on top, but still well below the Roche (1.95 Rp). The other metals are distributed at lower altitudes. The dashed black line represents the temperature profile presented by Fossati et al. (2021) accounting for NLTE effects. The full lines representing each species height distribution are shifted with respect to the dashed black line for clarity.
Current usage metrics show cumulative count of Article Views (full-text article views including HTML views, PDF and ePub downloads, according to the available data) and Abstracts Views on Vision4Press platform.
Data correspond to usage on the plateform after 2015. The current usage metrics is available 48-96 hours after online publication and is updated daily on week days.
Initial download of the metrics may take a while.