Fig. 2
Download original image
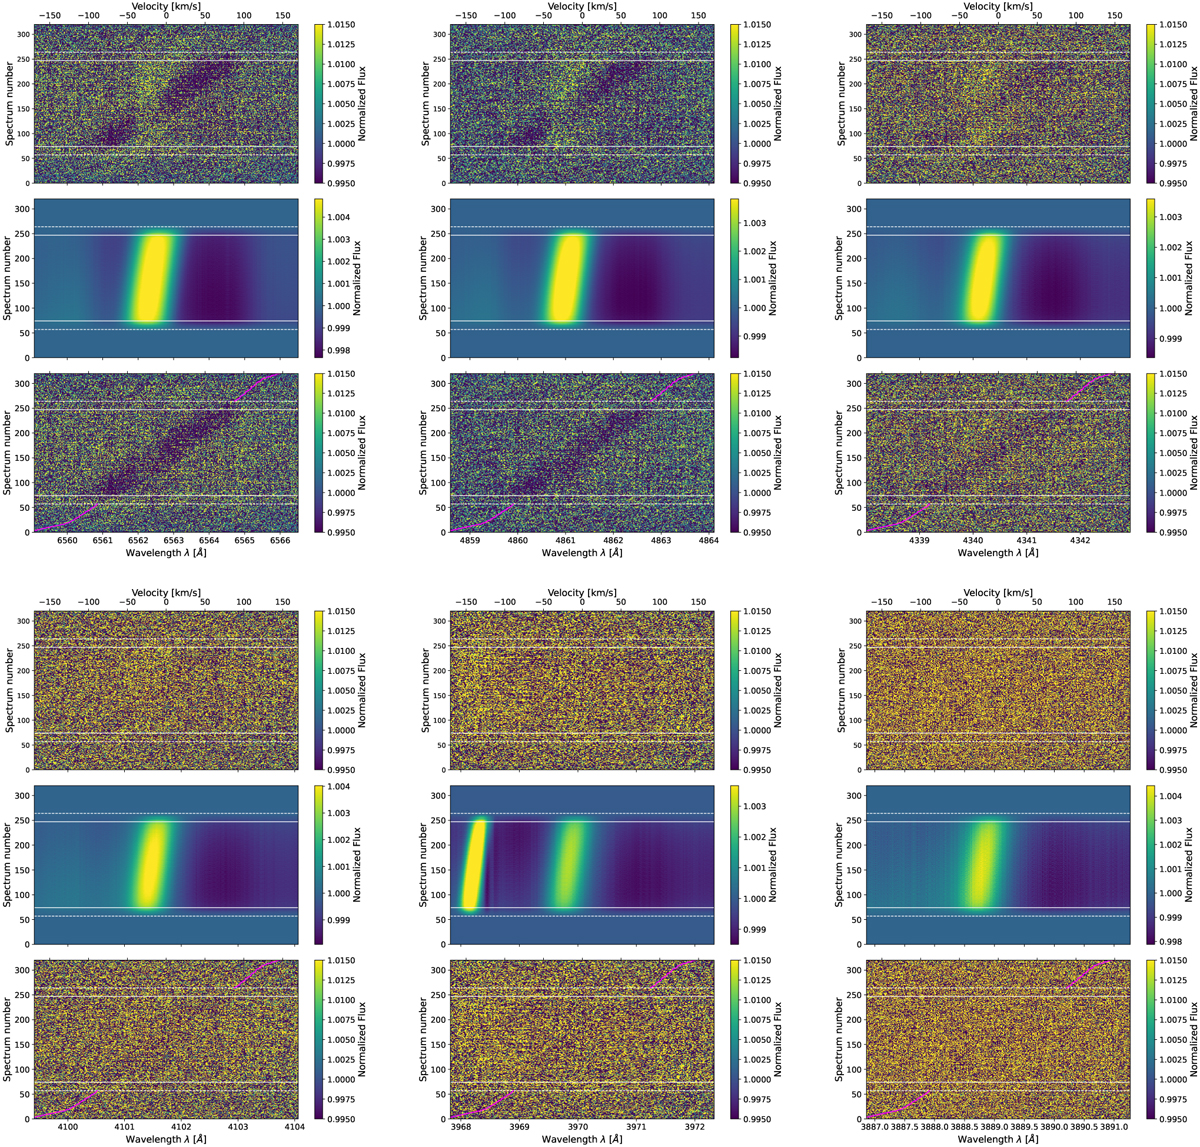
Tomographies in the stellar reference frame for the hydrogen Balmer lines. Top panels: raw tomographies before the RME+CLV correction. Top row, left to right: Hα, Hβ, and Hγ; bottom row, left to right: Hδ, Hϵ, and Hζ. The planetary atmospheric absorption can be distinguished as a darker region following the expected planetary radial velocity profile, and the RME as a brighter feature. We also show the planetary radial velocity profile during out-of-transit with a magenta line. The contact points are represented with dashed and continuous white lines. Middle panels: model tomography computed in the manner explained in Section 3. Bottom panels: corrected tomography obtained by dividing the raw one by the model one.
Current usage metrics show cumulative count of Article Views (full-text article views including HTML views, PDF and ePub downloads, according to the available data) and Abstracts Views on Vision4Press platform.
Data correspond to usage on the plateform after 2015. The current usage metrics is available 48-96 hours after online publication and is updated daily on week days.
Initial download of the metrics may take a while.