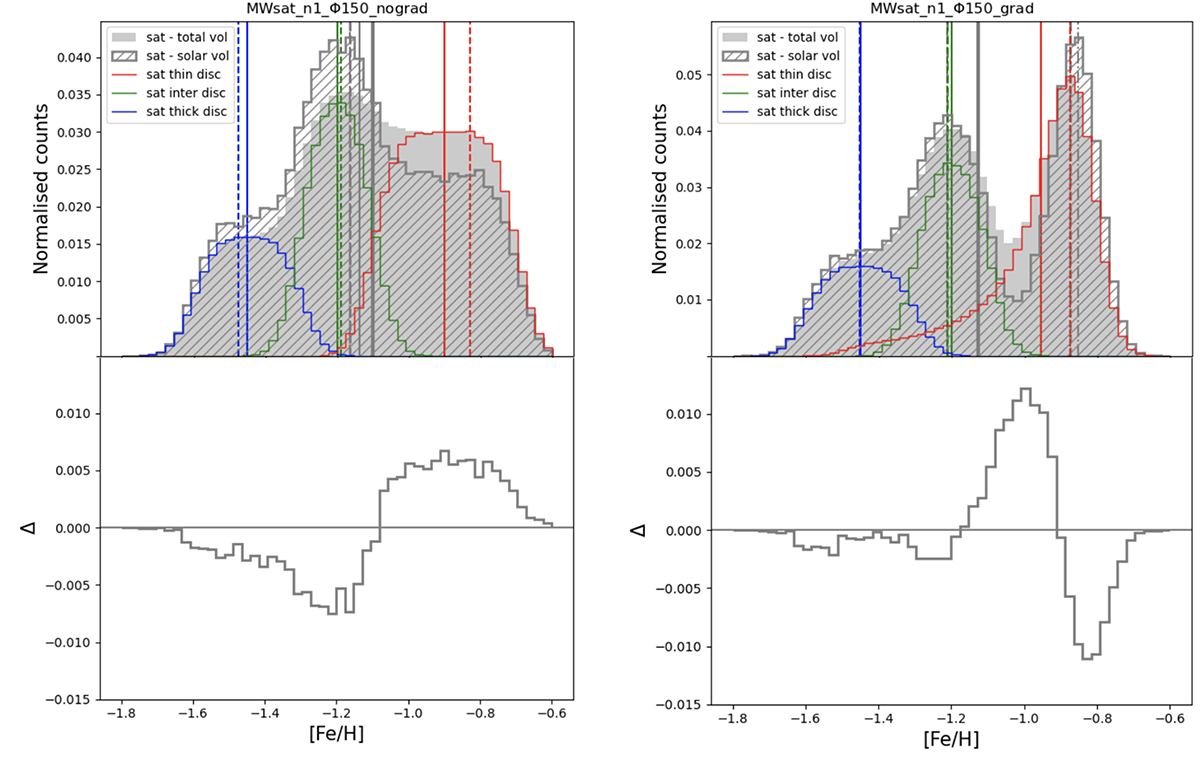
Fig. 9.
Download original image
Top panels: MDF of the satellite stars (in filled blue) and the same MDF restricted to the satellite stars that reach a solar-like volume by the end of the simulation (in patterned blue). The solid lines are the means of the distributions (broader for the total distribution, thinner for the solar one). The dashed (dash-dotted) lines are the peak(s) of the total (solar) distribution. The satellite MDF divided into disc components is shown by the red, green, and blue curves for the thin, intermediate, and thick discs, respectively. Bottom panel: Difference between the two normalised distributions in the top panel (Δ), i.e. the total distribution minus the solar-like restricted one. The left column shows the case with the vertical metallicity gradient only, and the right column the one with the additional radial metallicity gradient.
Current usage metrics show cumulative count of Article Views (full-text article views including HTML views, PDF and ePub downloads, according to the available data) and Abstracts Views on Vision4Press platform.
Data correspond to usage on the plateform after 2015. The current usage metrics is available 48-96 hours after online publication and is updated daily on week days.
Initial download of the metrics may take a while.