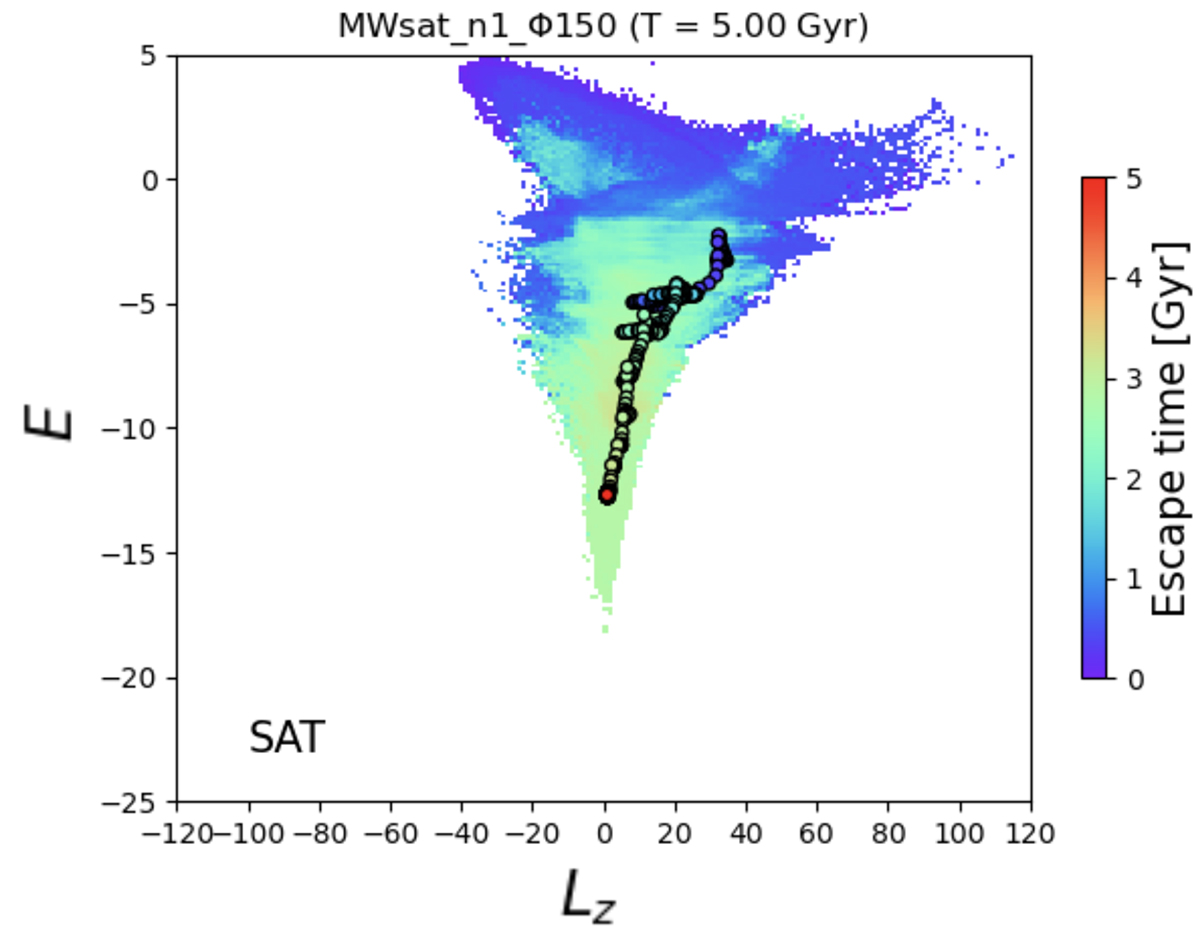
Fig. 3.
Download original image
Final distribution of the satellite stars in the E − Lz space as in the middle column of Figure 2, but colour-coded by their escape time from the satellite potential. The dots represent the mean values of energy and z component of the angular momentum of bound satellite stars, defined by being less than 15 kpc from its barycentre. There are five hundred dots (one for each snapshot of the simulation) and they are colour-coded with the same colour-bar scale but for the time of the simulation (every 10 Myr to cover the 5 Gyr time interval).
Current usage metrics show cumulative count of Article Views (full-text article views including HTML views, PDF and ePub downloads, according to the available data) and Abstracts Views on Vision4Press platform.
Data correspond to usage on the plateform after 2015. The current usage metrics is available 48-96 hours after online publication and is updated daily on week days.
Initial download of the metrics may take a while.