Fig. 9.
Download original image
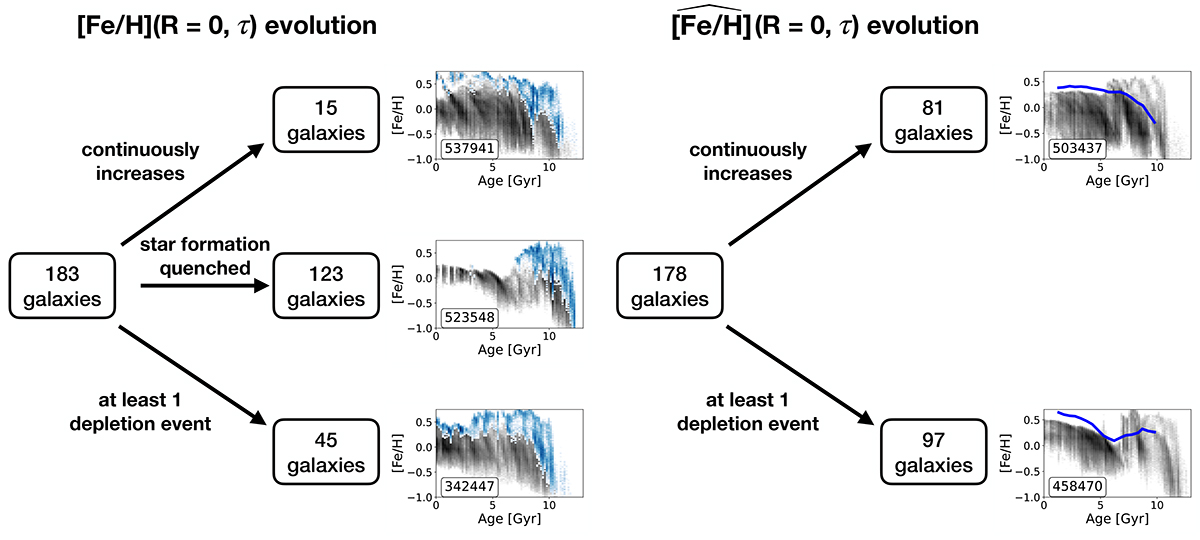
Schematic illustrating the distribution of galaxies and how their left: [Fe/H](R = 0 kpc, τ) and right: ![]() = 0 kpc) evolves over time. The evolution of the true central metallicity (left) was estimated by tracing how [Fe/H] in the central kpc of the galactic disk sample enriches over time. Of the 183 galaxies that have enough disk stars born within the inner kpc, only 15 of them are found to have their centers predominantly continuously enrich in [Fe/H] over cosmic time, while 45 of the galaxies are found to have at least one major depletion event in their galactic centers. The remaining 123 galaxies had star formation quench before redshift 0 in their center. An example of each of these scenarios is given, where the density of the age–metallicity relation for our defined disk sample (grey) and stellar particles with Rbirth < 1 kpc (blue) is shown. The evolution of the projected central metallicity (right) was determined by tracing the projected [Fe/H] at Rbirth = 0 kpc using the metallicity at a given radius and the current metallicity gradient (see Figure 7 for an example).
= 0 kpc) evolves over time. The evolution of the true central metallicity (left) was estimated by tracing how [Fe/H] in the central kpc of the galactic disk sample enriches over time. Of the 183 galaxies that have enough disk stars born within the inner kpc, only 15 of them are found to have their centers predominantly continuously enrich in [Fe/H] over cosmic time, while 45 of the galaxies are found to have at least one major depletion event in their galactic centers. The remaining 123 galaxies had star formation quench before redshift 0 in their center. An example of each of these scenarios is given, where the density of the age–metallicity relation for our defined disk sample (grey) and stellar particles with Rbirth < 1 kpc (blue) is shown. The evolution of the projected central metallicity (right) was determined by tracing the projected [Fe/H] at Rbirth = 0 kpc using the metallicity at a given radius and the current metallicity gradient (see Figure 7 for an example). ![]() = 0 kpc) traces the central metallicity assuming a linear metallicity gradient, and acts as an anchor point for the disk’s gradient, regardless if the true central metallicity spikes in the galactic center. Of the 178 galaxies with enough disk stars to appropriately trace the time evolution of
= 0 kpc) traces the central metallicity assuming a linear metallicity gradient, and acts as an anchor point for the disk’s gradient, regardless if the true central metallicity spikes in the galactic center. Of the 178 galaxies with enough disk stars to appropriately trace the time evolution of ![]() = 0 kpc), we find 81 galaxies show a continuous enrichment at Rbirth = 0 kpc, while 97 have at least one major depletion event. Examples of these two scenarios are given next to the respective outcome, with the blue line indicating the projected central metallicity, estimated using age bins of 0.5 Gyr. The central metallicity of the Milky Way is assumed to continuously increase in current methods, with potentially only minor deviations from this assumption (see Section 6.1.1).
= 0 kpc), we find 81 galaxies show a continuous enrichment at Rbirth = 0 kpc, while 97 have at least one major depletion event. Examples of these two scenarios are given next to the respective outcome, with the blue line indicating the projected central metallicity, estimated using age bins of 0.5 Gyr. The central metallicity of the Milky Way is assumed to continuously increase in current methods, with potentially only minor deviations from this assumption (see Section 6.1.1).
Current usage metrics show cumulative count of Article Views (full-text article views including HTML views, PDF and ePub downloads, according to the available data) and Abstracts Views on Vision4Press platform.
Data correspond to usage on the plateform after 2015. The current usage metrics is available 48-96 hours after online publication and is updated daily on week days.
Initial download of the metrics may take a while.