Fig. 2.
Download original image
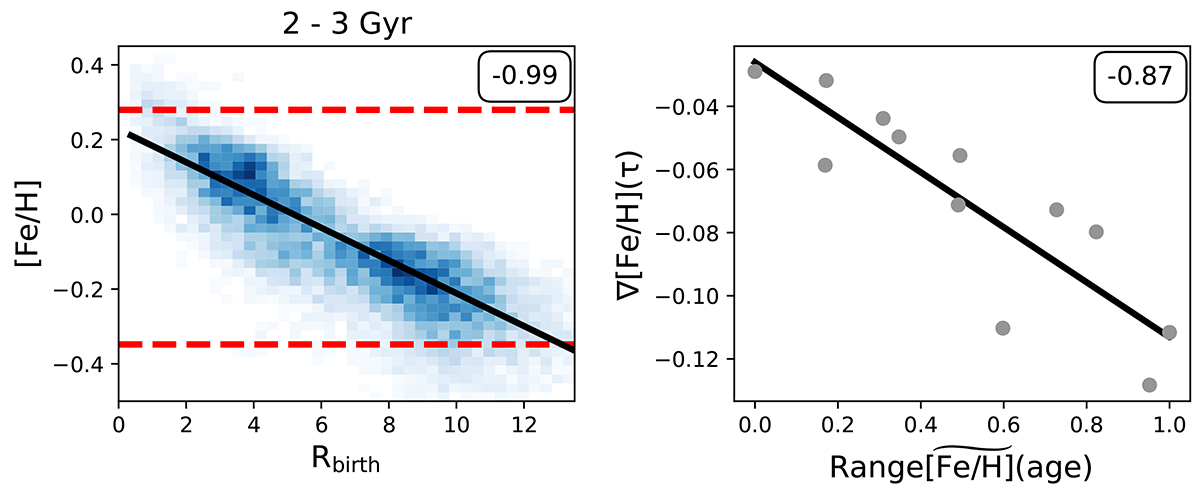
Example (subhalo 577372) illustrating the recovery of ∇[Fe/H](τ) from ![]() . Left: Density distribution of the [Fe/H]–Rbirth plane for stars born 2 − 3 Gyr ago. The correlation between the [Fe/H] running median and Rbirth is given in the top right corner. The fitted true birth gradient is shown as the black line, and the maximum and minimum [Fe/H] used to determine the range are shown as the dashed red lines. Right: ∇[Fe/H](τ) versus
. Left: Density distribution of the [Fe/H]–Rbirth plane for stars born 2 − 3 Gyr ago. The correlation between the [Fe/H] running median and Rbirth is given in the top right corner. The fitted true birth gradient is shown as the black line, and the maximum and minimum [Fe/H] used to determine the range are shown as the dashed red lines. Right: ∇[Fe/H](τ) versus ![]() for the same galaxy, with each point representing a different age bin (width 1 Gyr).
for the same galaxy, with each point representing a different age bin (width 1 Gyr). ![]() is determined by looking at the range in [Fe/H] across all age bins, and then normalized so the minimum range is given a value of 0, and the maximum range is given a value of 1. The correlation between
is determined by looking at the range in [Fe/H] across all age bins, and then normalized so the minimum range is given a value of 0, and the maximum range is given a value of 1. The correlation between ![]() and ∇[Fe/H](τ) for this galaxy is −0.87, indicating the evolution of the gradient can be recovered well from
and ∇[Fe/H](τ) for this galaxy is −0.87, indicating the evolution of the gradient can be recovered well from ![]() .
.
Current usage metrics show cumulative count of Article Views (full-text article views including HTML views, PDF and ePub downloads, according to the available data) and Abstracts Views on Vision4Press platform.
Data correspond to usage on the plateform after 2015. The current usage metrics is available 48-96 hours after online publication and is updated daily on week days.
Initial download of the metrics may take a while.