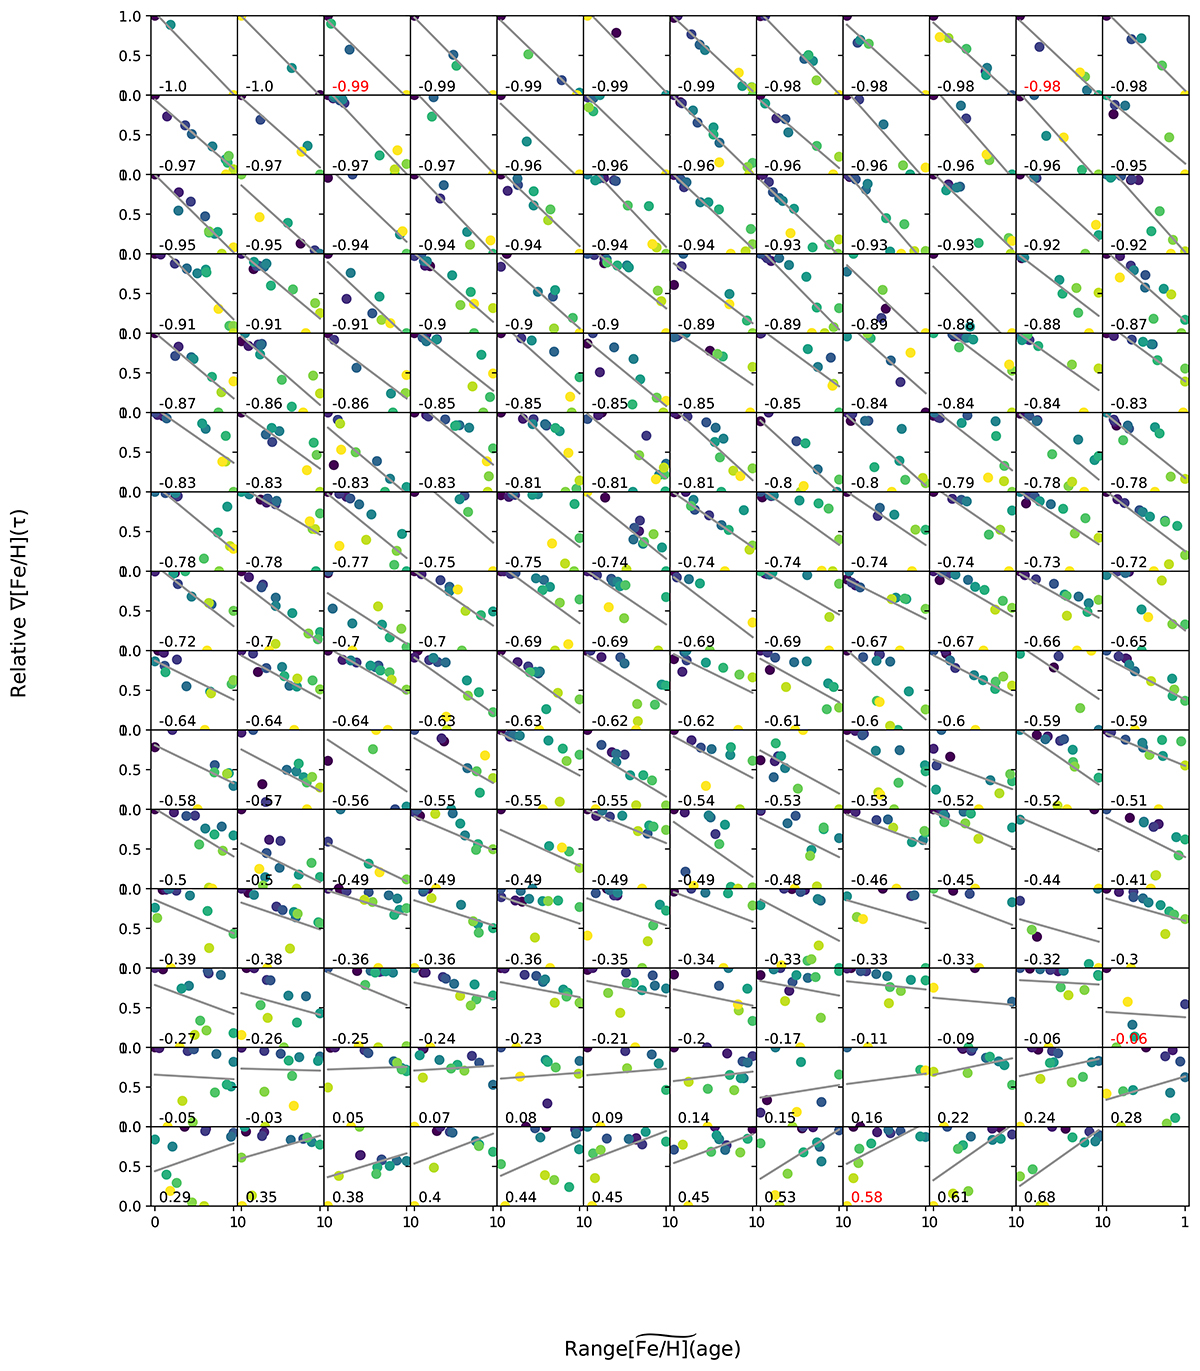
Fig. B.2.
Download original image
Relationship between scatter in [Fe/H] and [Fe/H] radial birth gradient. Each point represents a different age bin, colored from youngest (blue) to oldest (yellow). The grey line is the line of best-fit. The correlation between ∇[Fe/H](τ) and ![]() is given in the bottom left of each panel. The red font indicates the galaxies analysed in Figure 5.
is given in the bottom left of each panel. The red font indicates the galaxies analysed in Figure 5.
Current usage metrics show cumulative count of Article Views (full-text article views including HTML views, PDF and ePub downloads, according to the available data) and Abstracts Views on Vision4Press platform.
Data correspond to usage on the plateform after 2015. The current usage metrics is available 48-96 hours after online publication and is updated daily on week days.
Initial download of the metrics may take a while.